Calculus Applets
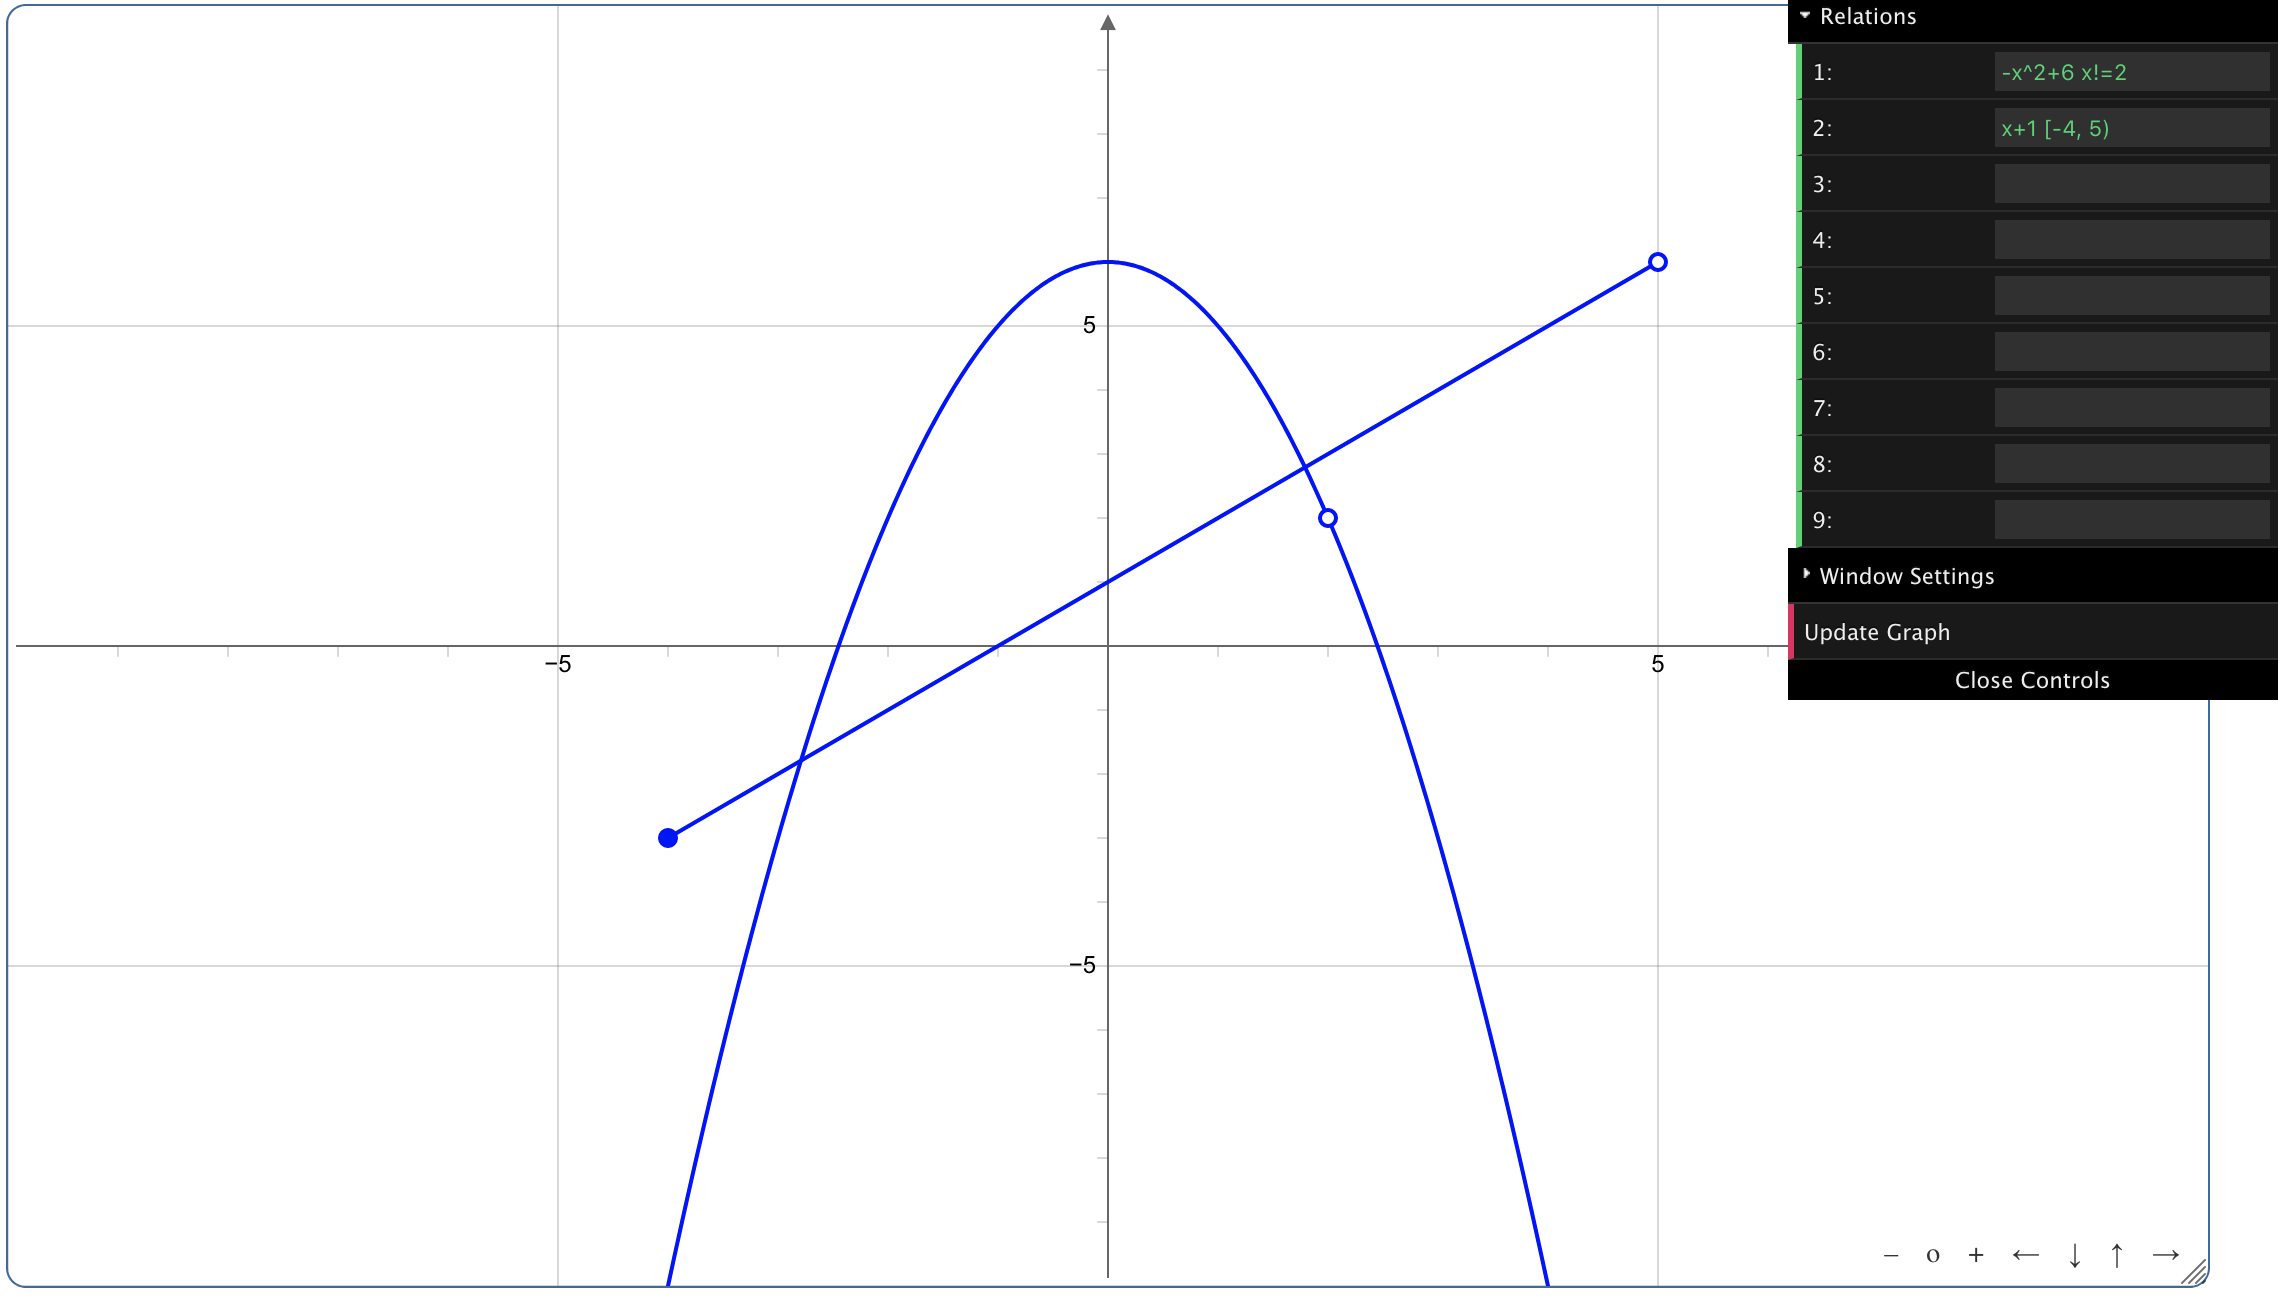
Grapher
Allows graphing of equations on the Cartesian coordinate system.
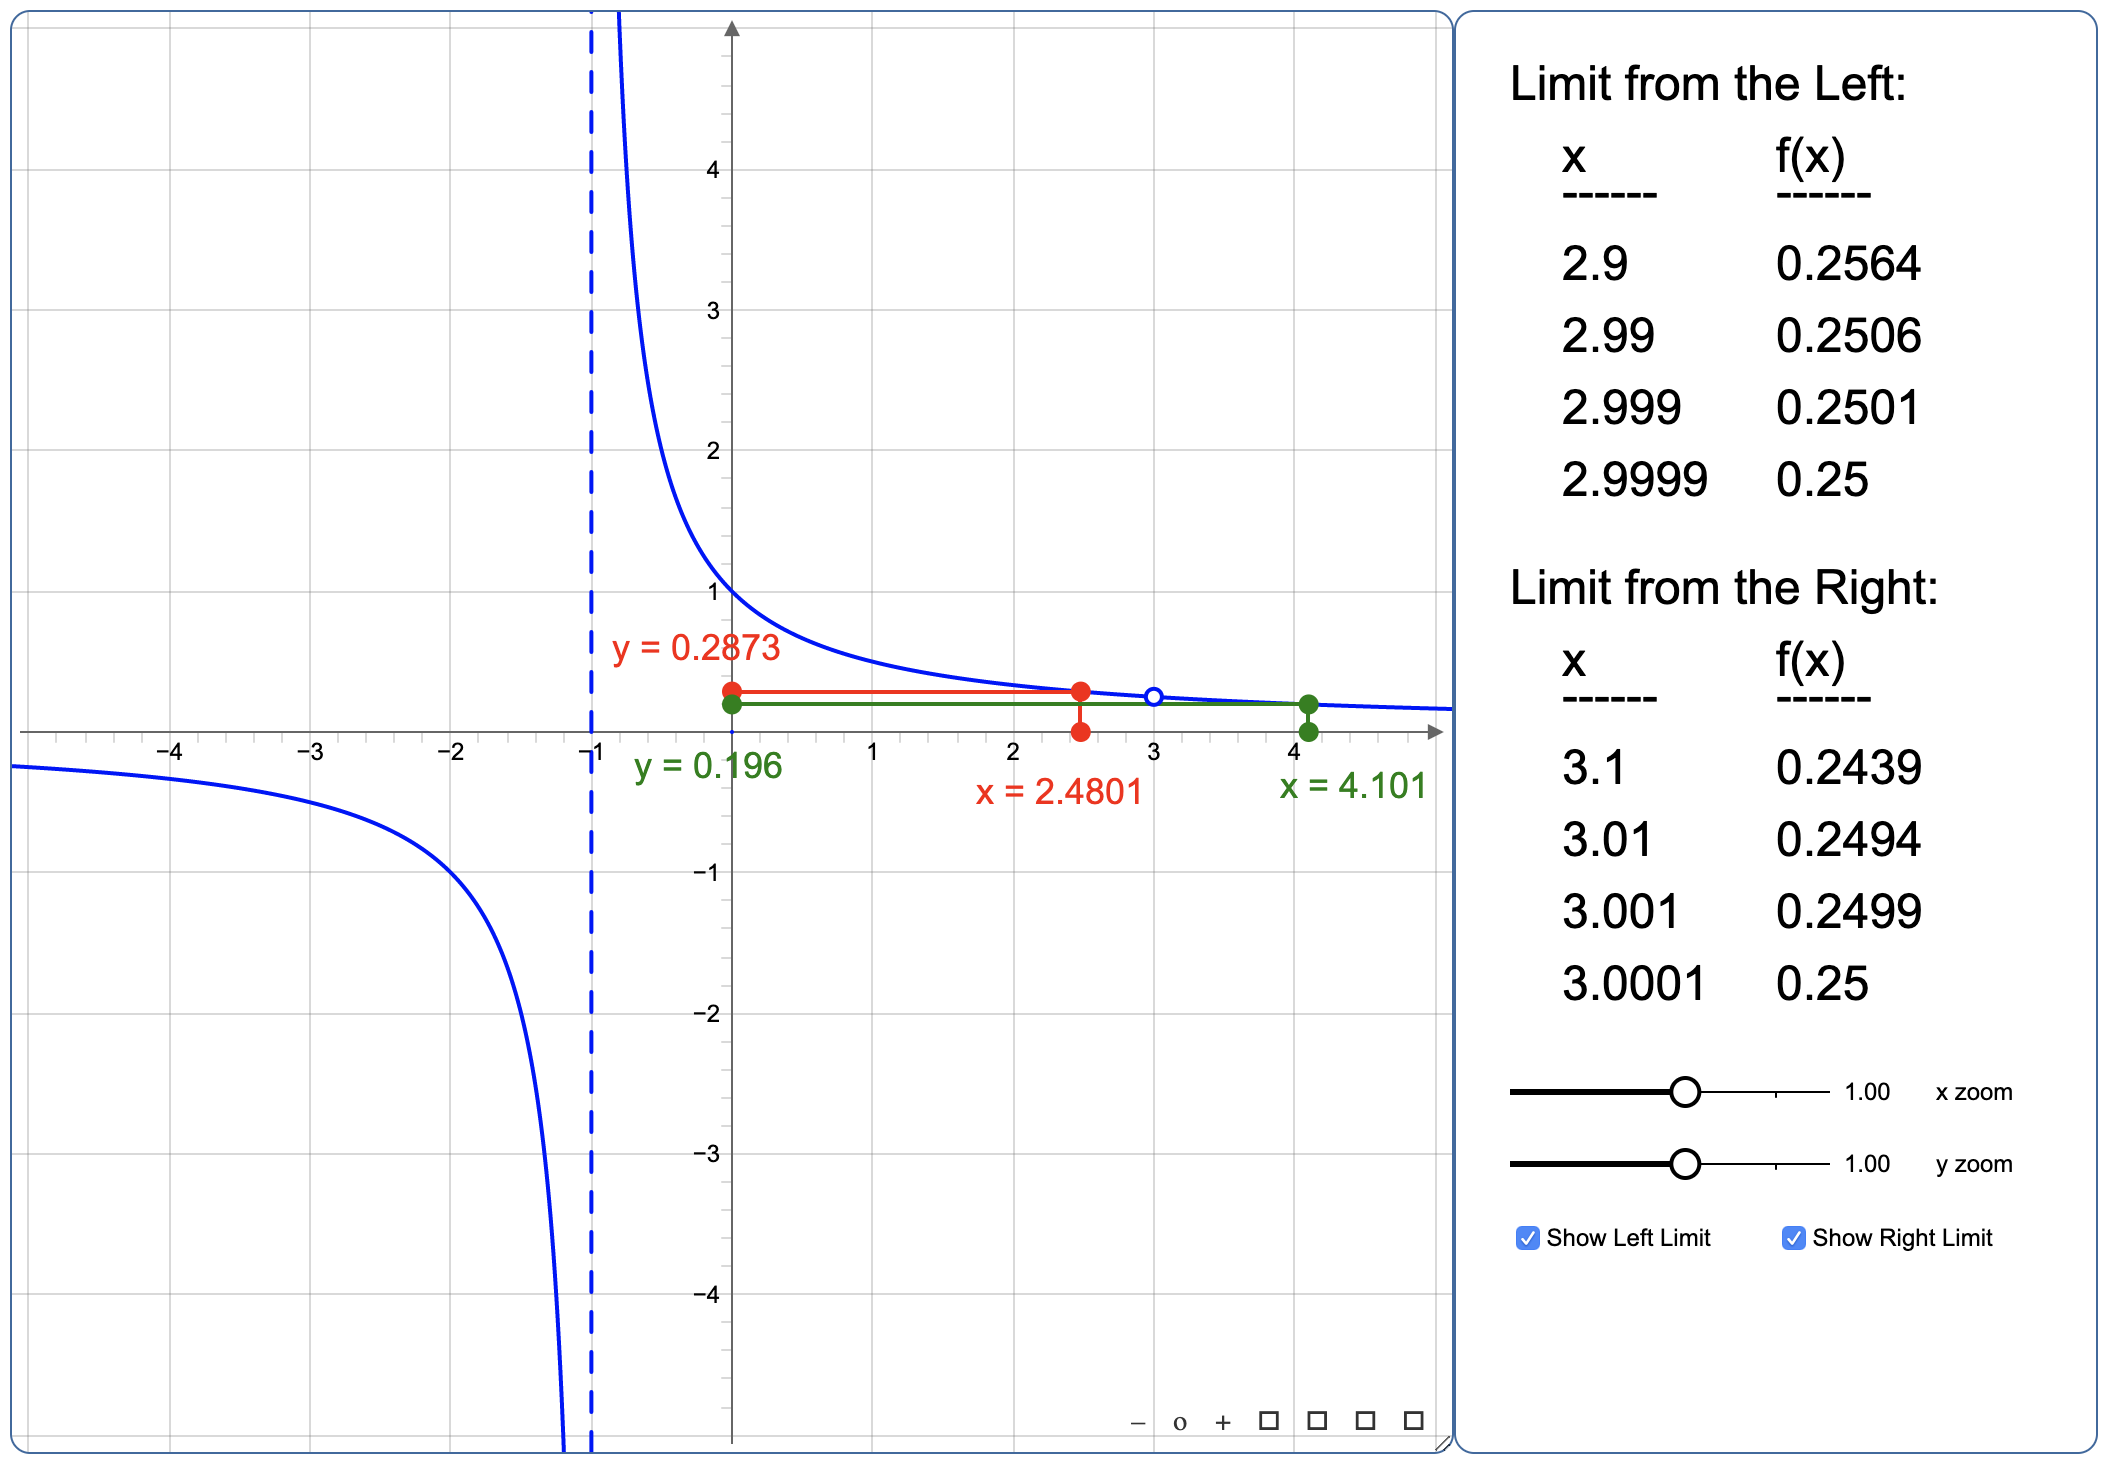
Graphical and Numeric Limits
Demonstrates how limits are found using graphical and numerical techniques. Includes
functionality to support piecewise defined functions.
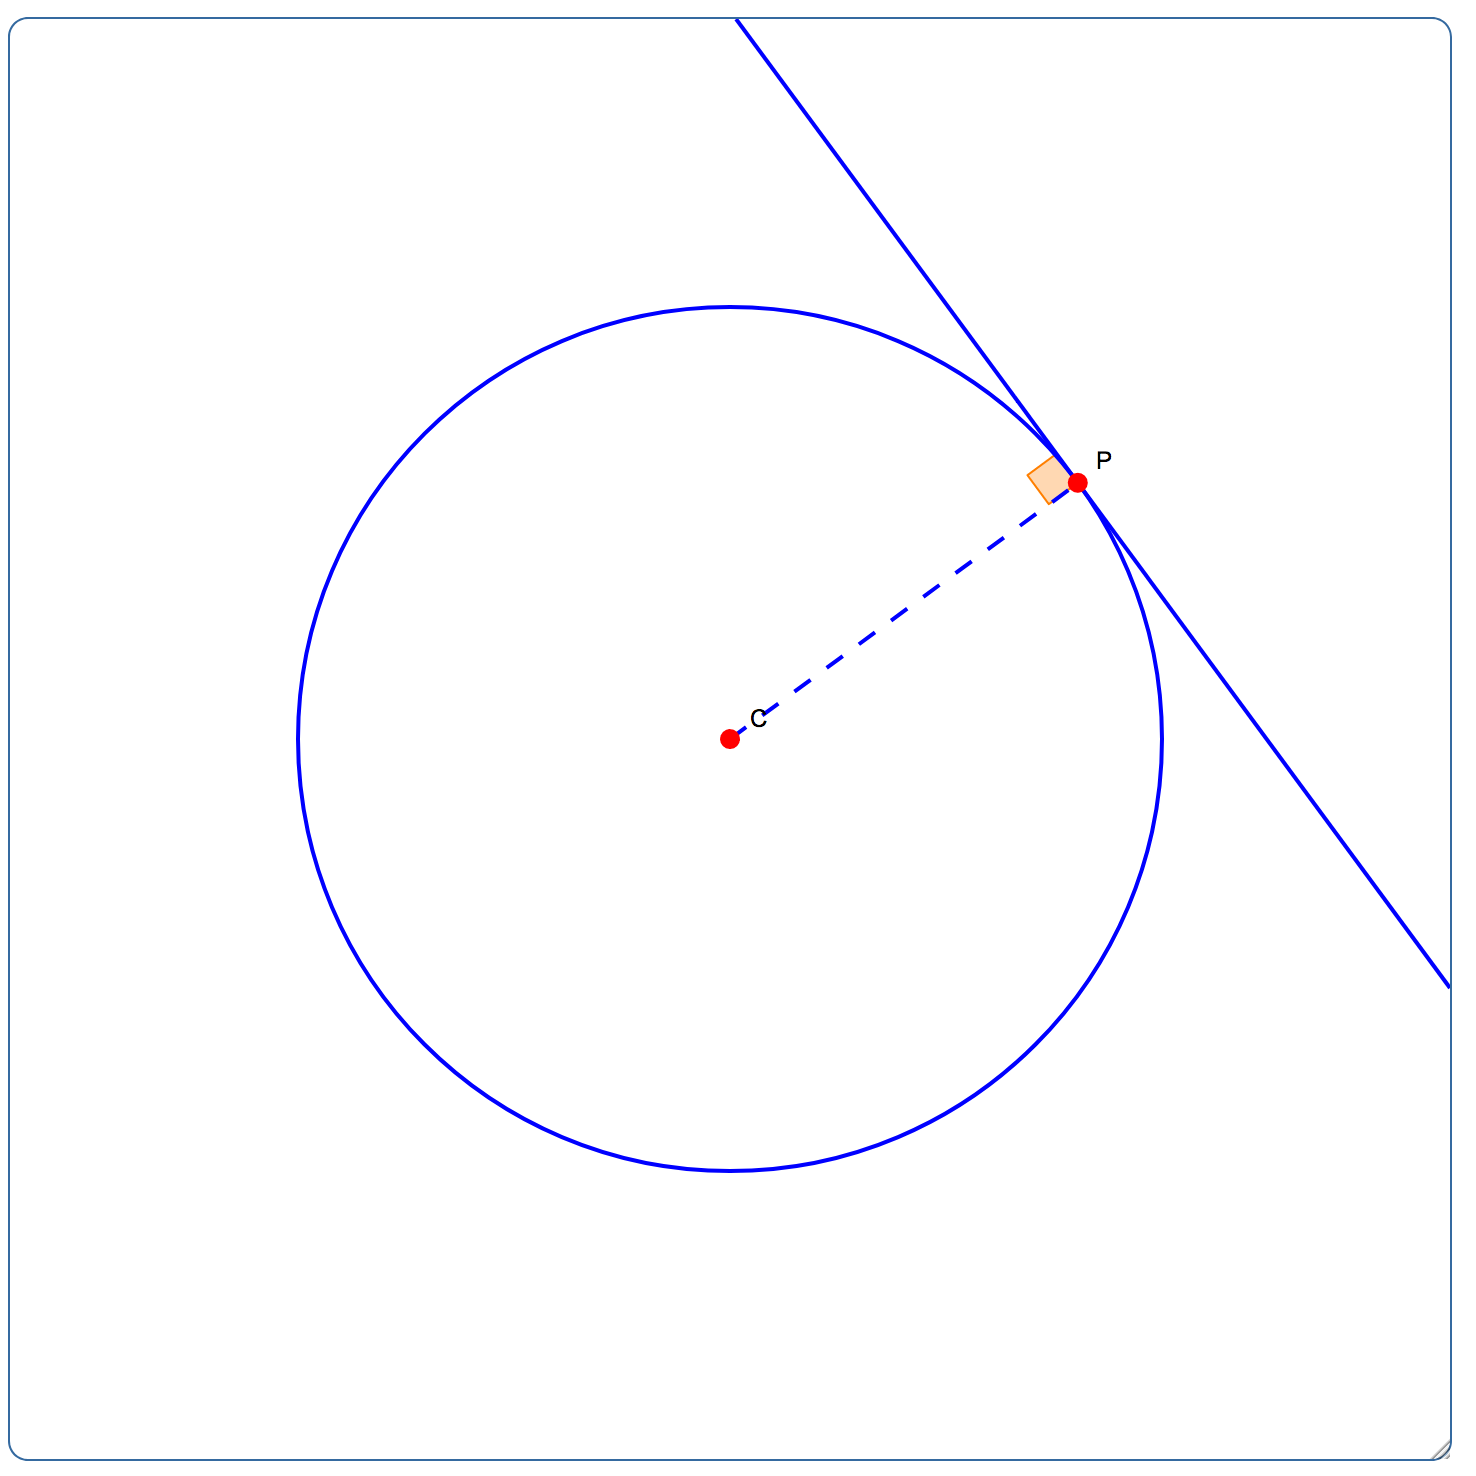
Tangent to a Circle
Demonstrates how a tangent line to a circle looks.
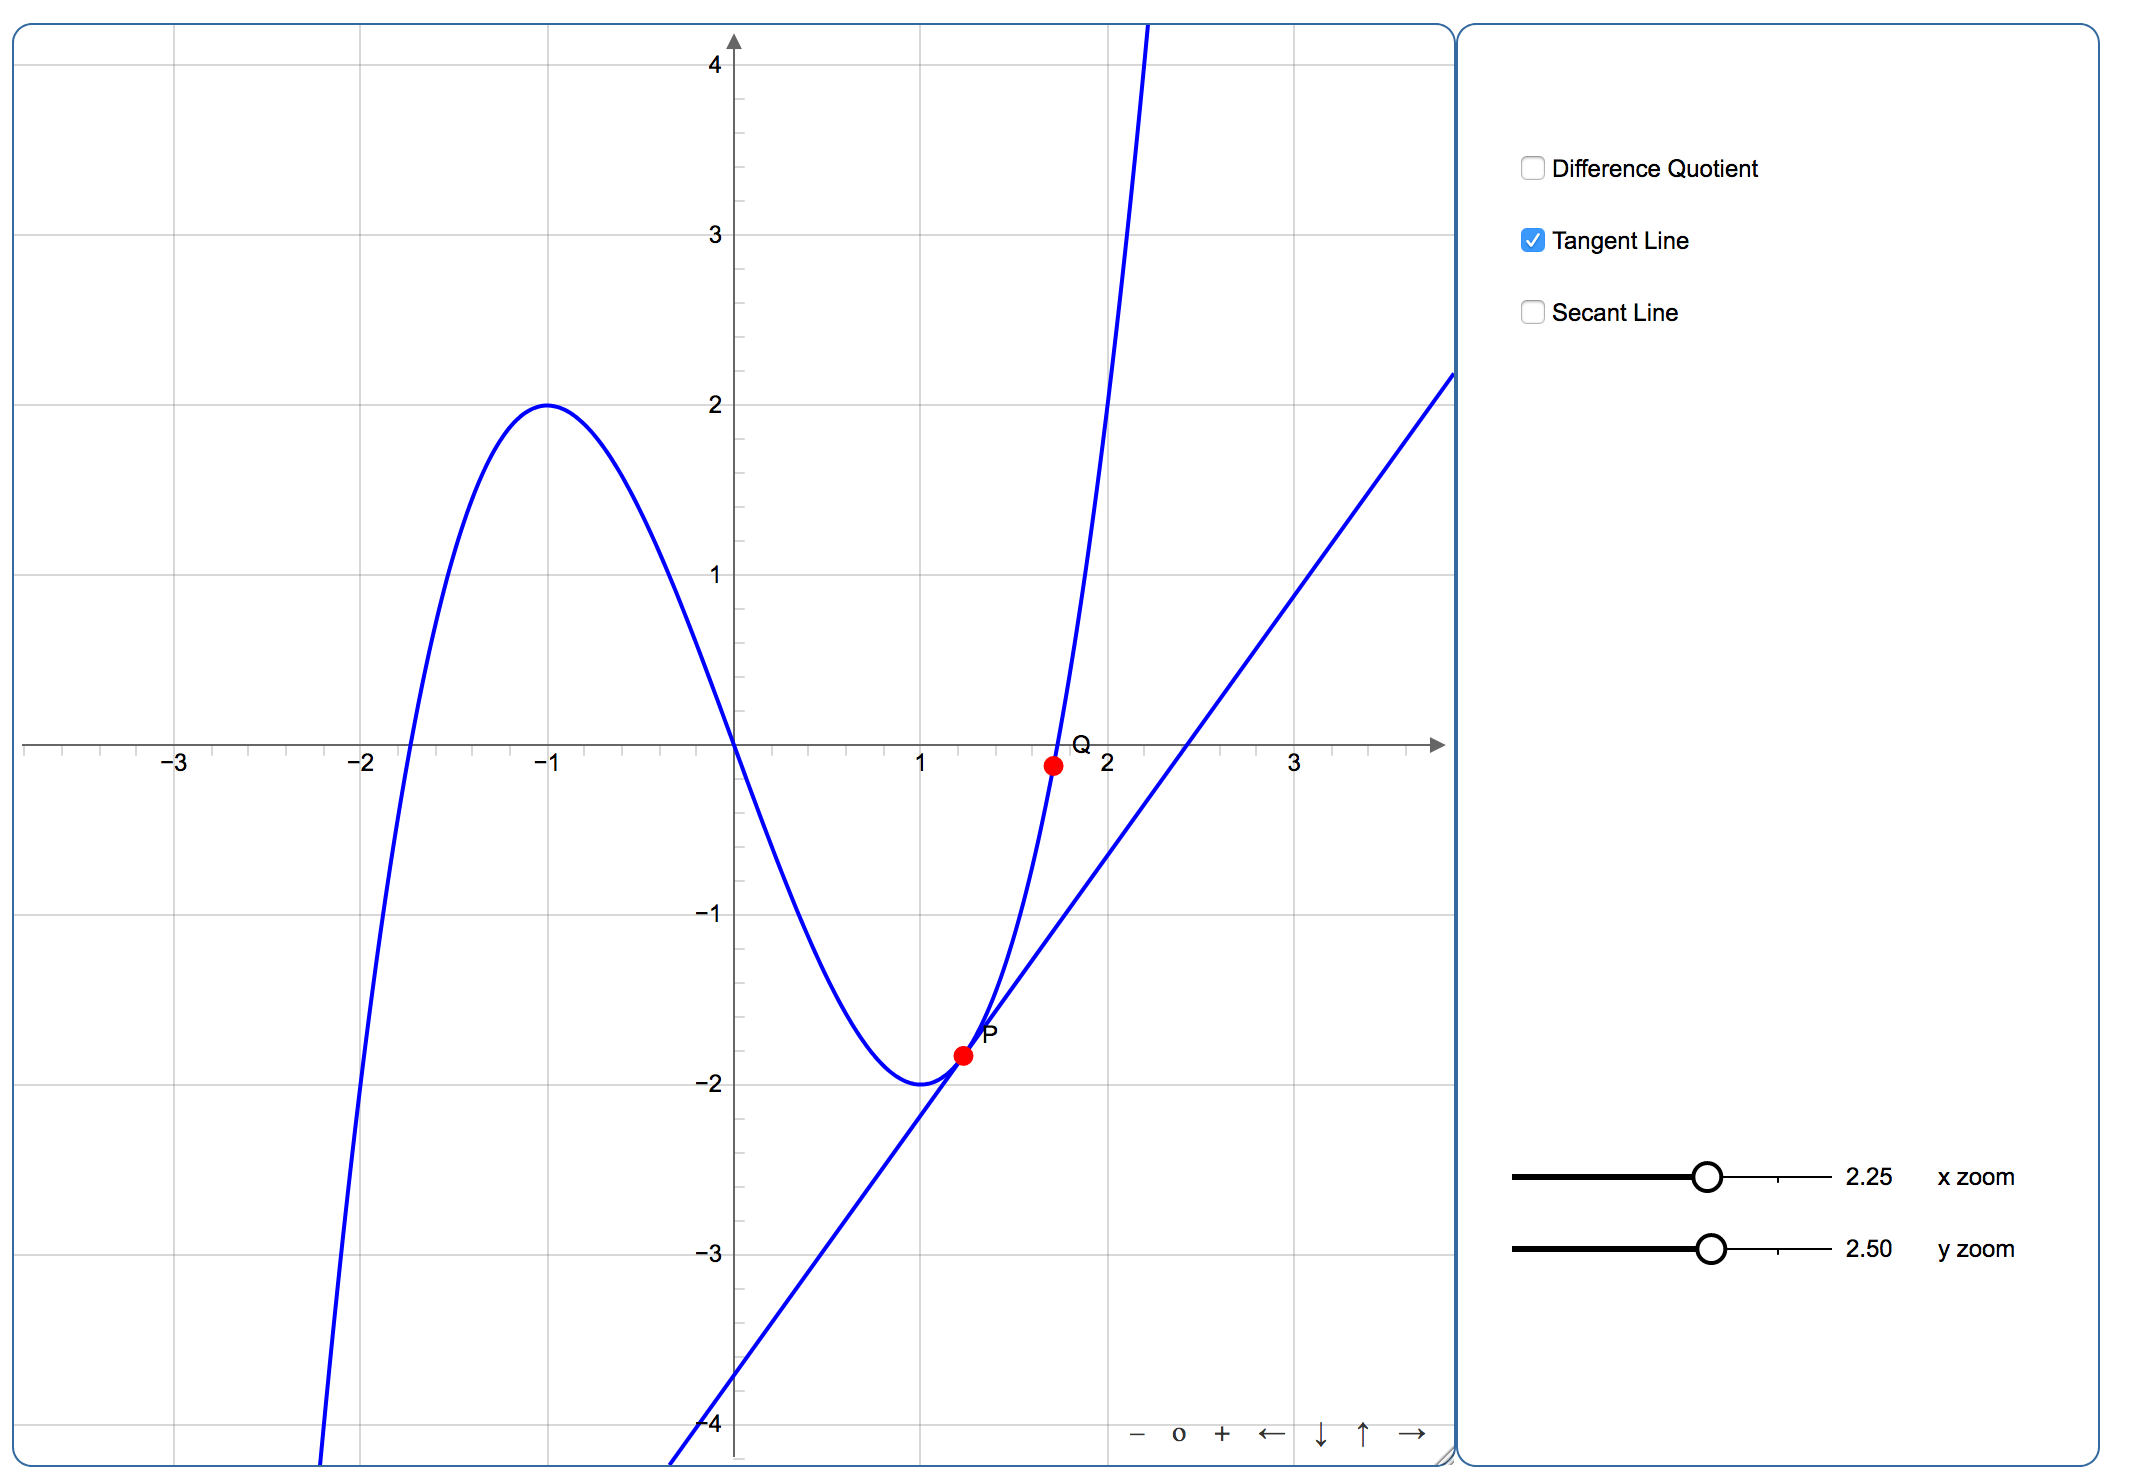
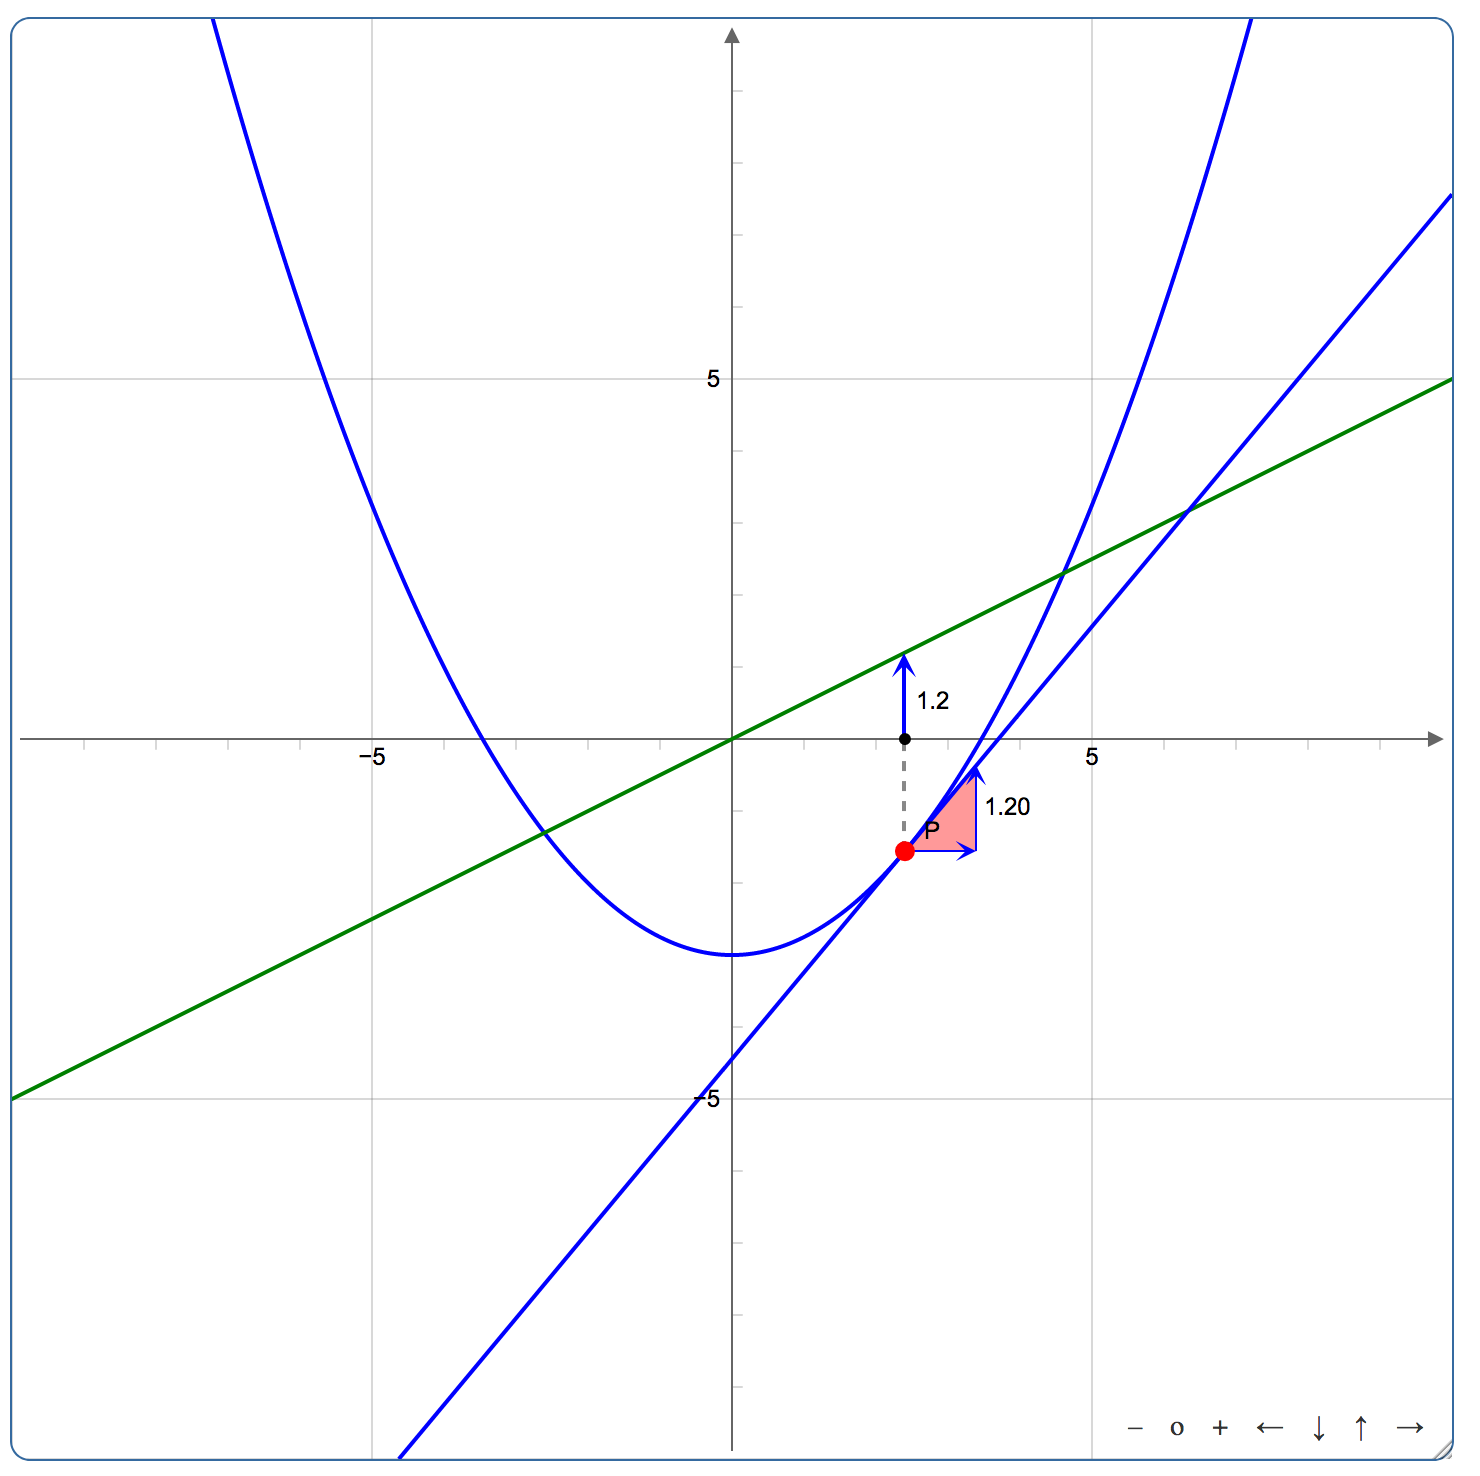
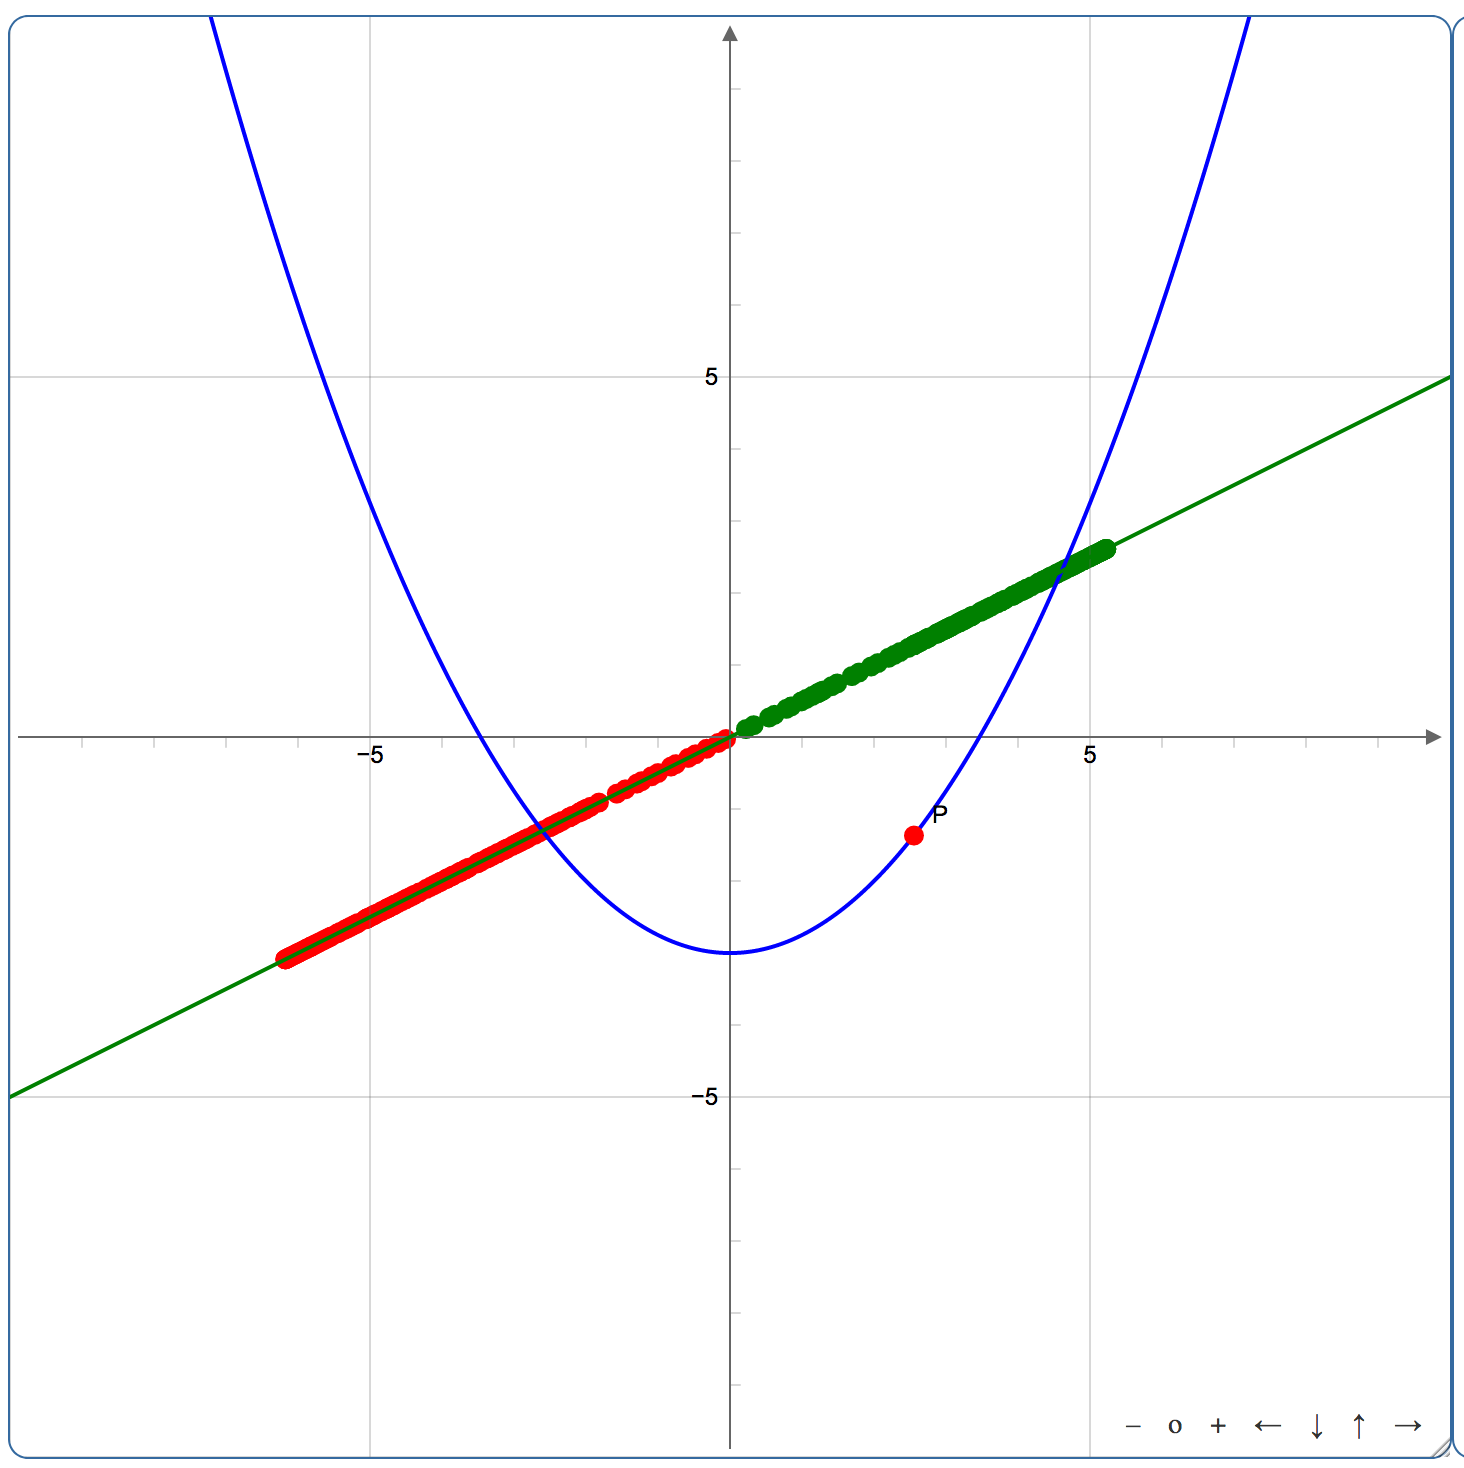
Tangent and Secant Lines
Illustrates the relationship between tangent lines and secant lines to a given graph.
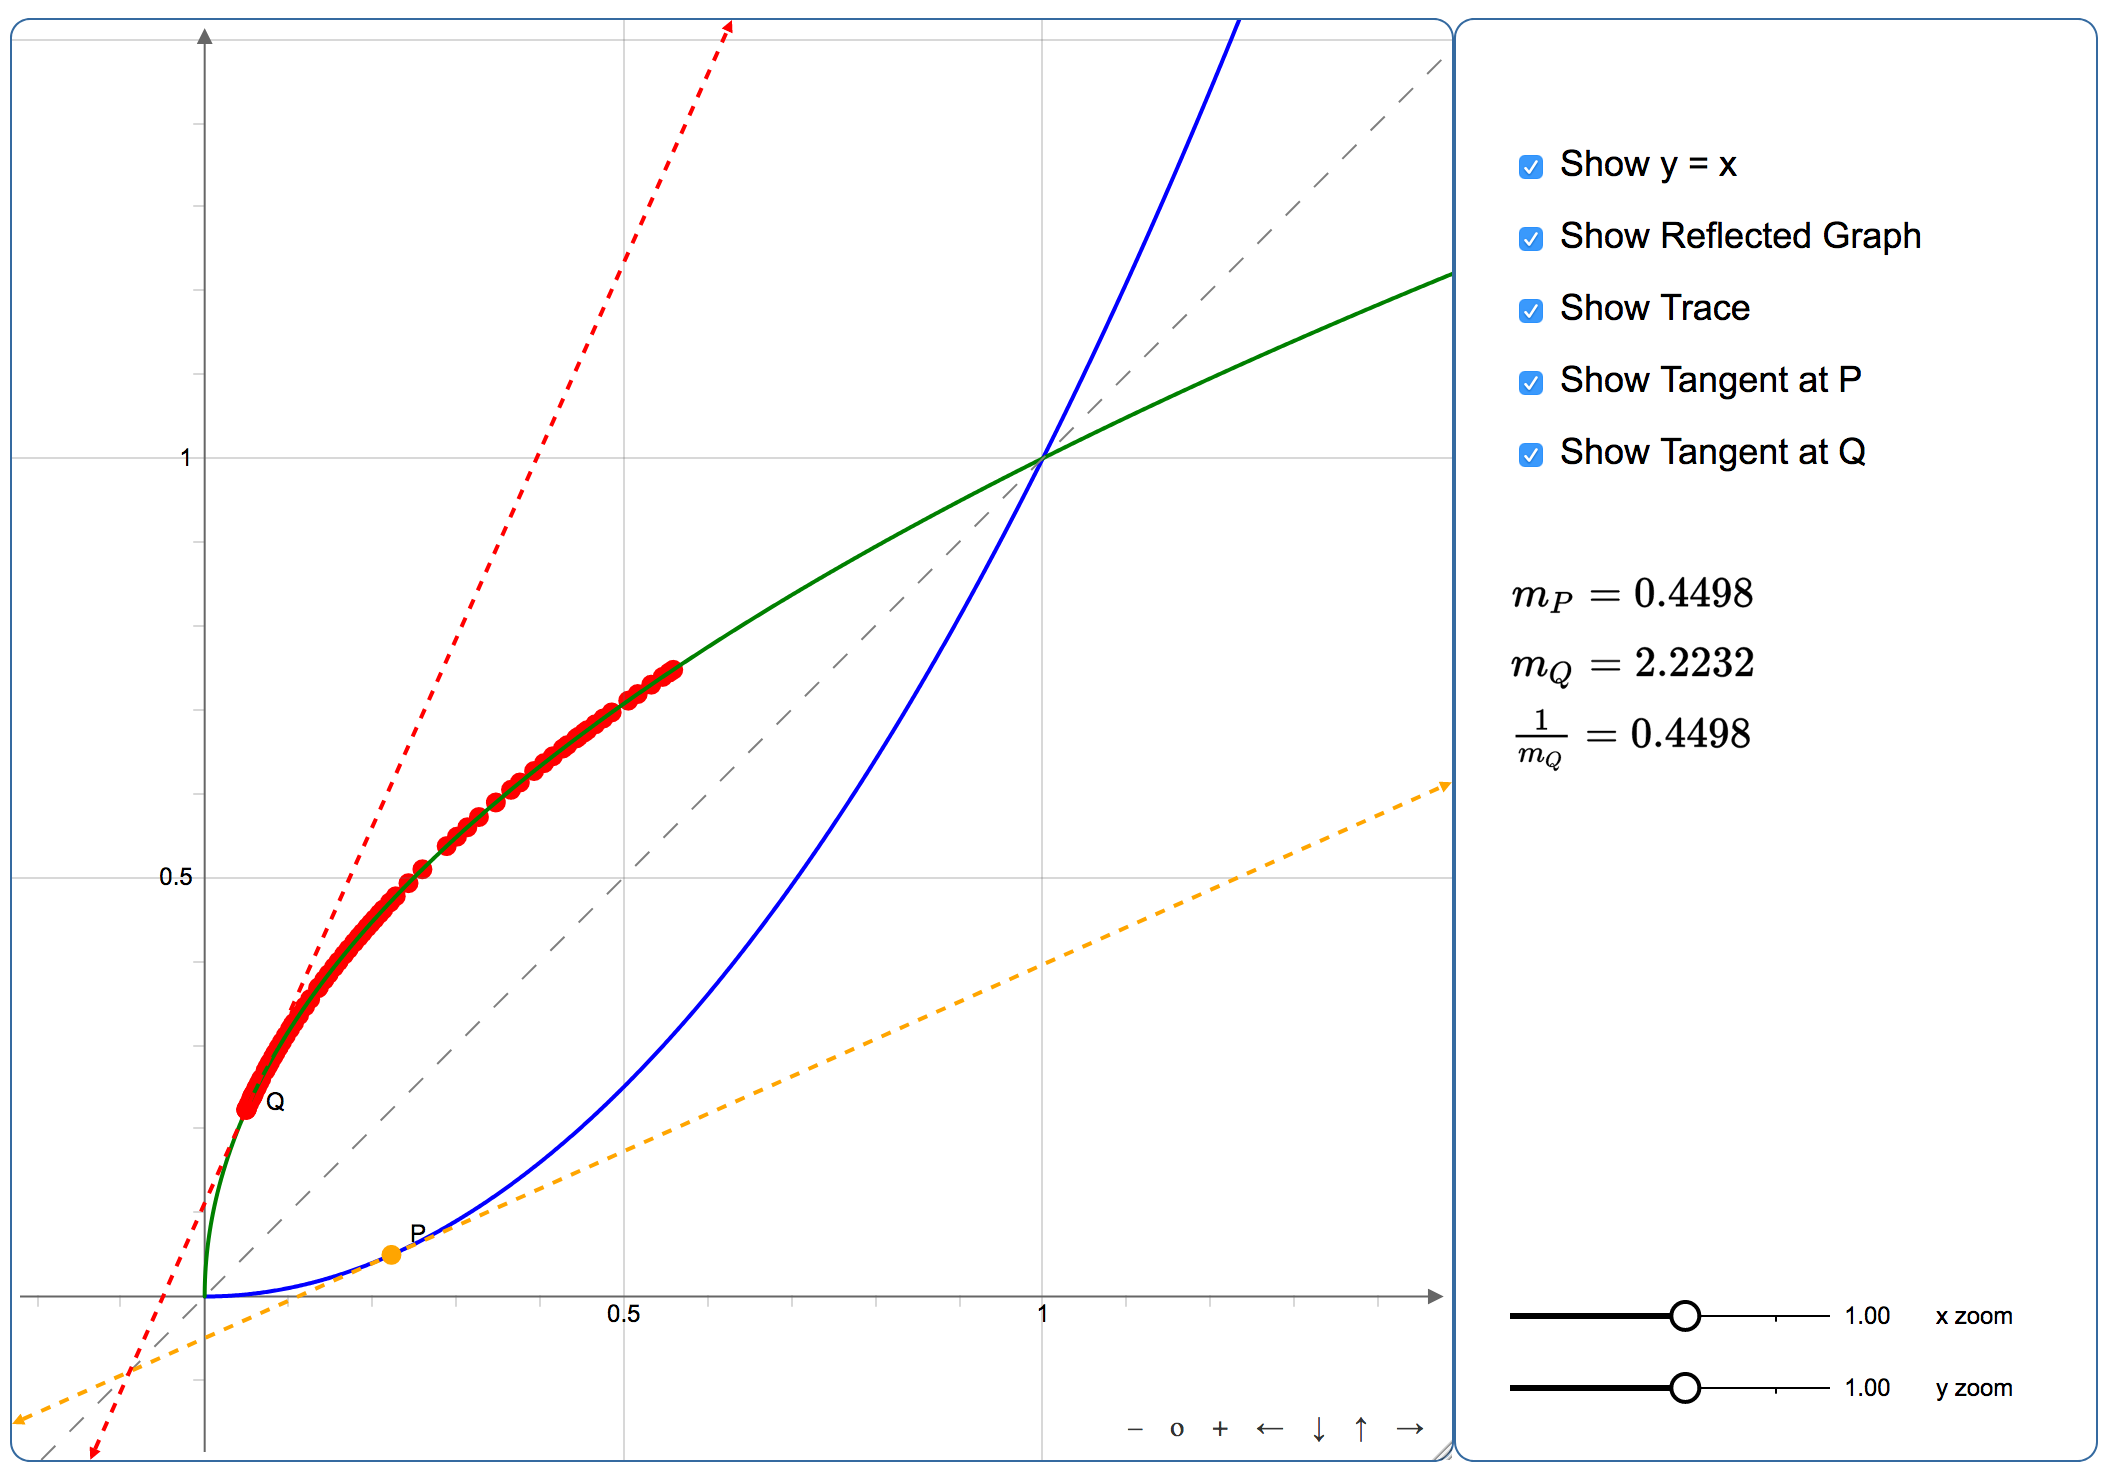
Derivatives of Inverse Functions
Demonstrates the relationship between a function and it's inverse with respect to the slopes of tangent lines.
Absolute Extrema
Demonstrates the how to find an absolute extrema on a closed interval.
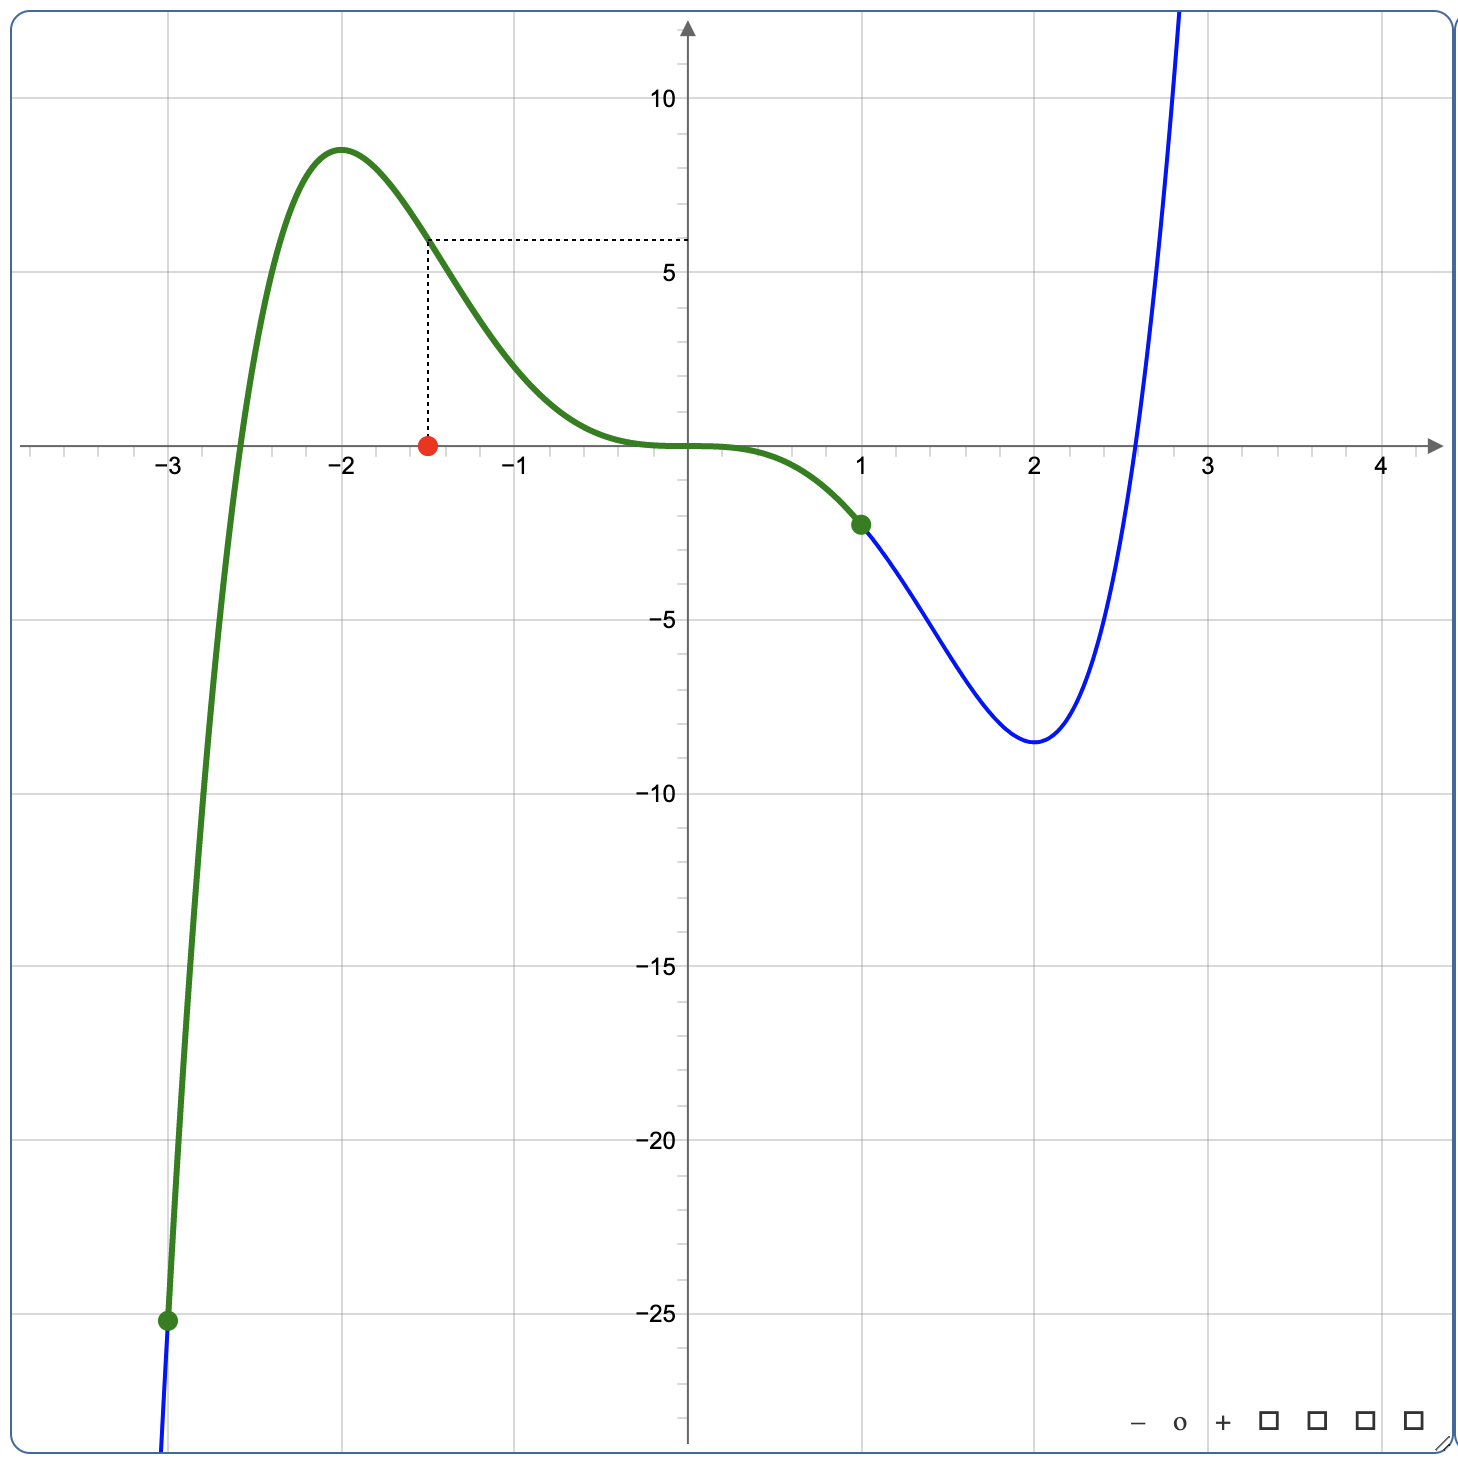
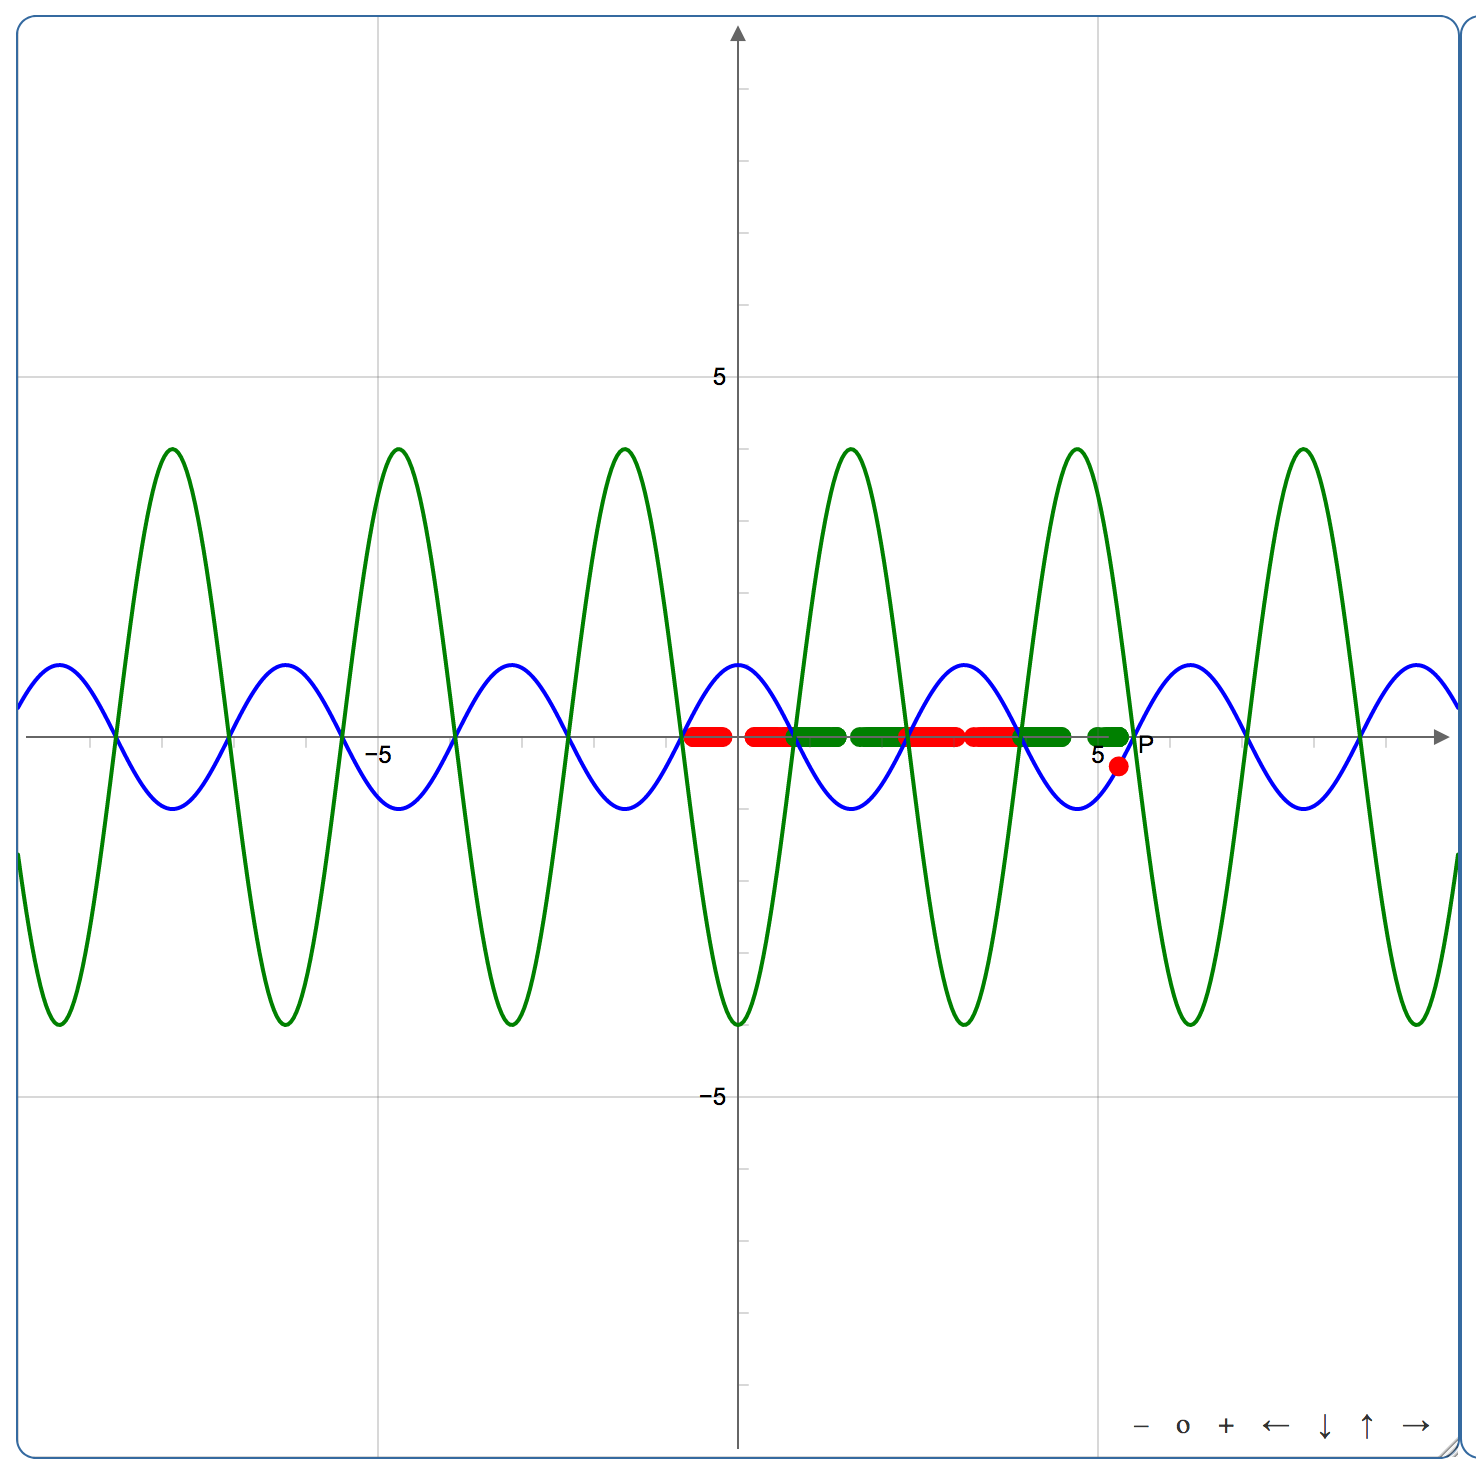
First Derivative Graph
Demonstrates how the graph of the first derivative is obtained from a given function.
First Derivative Test
Shows how the graph of the derivative of a function can be used to determine where a function is increasing or decreasing.
Second Derivative Test
Shows how the graph of the second derivative of a function can be used to determine where a function is concave up or concave down.
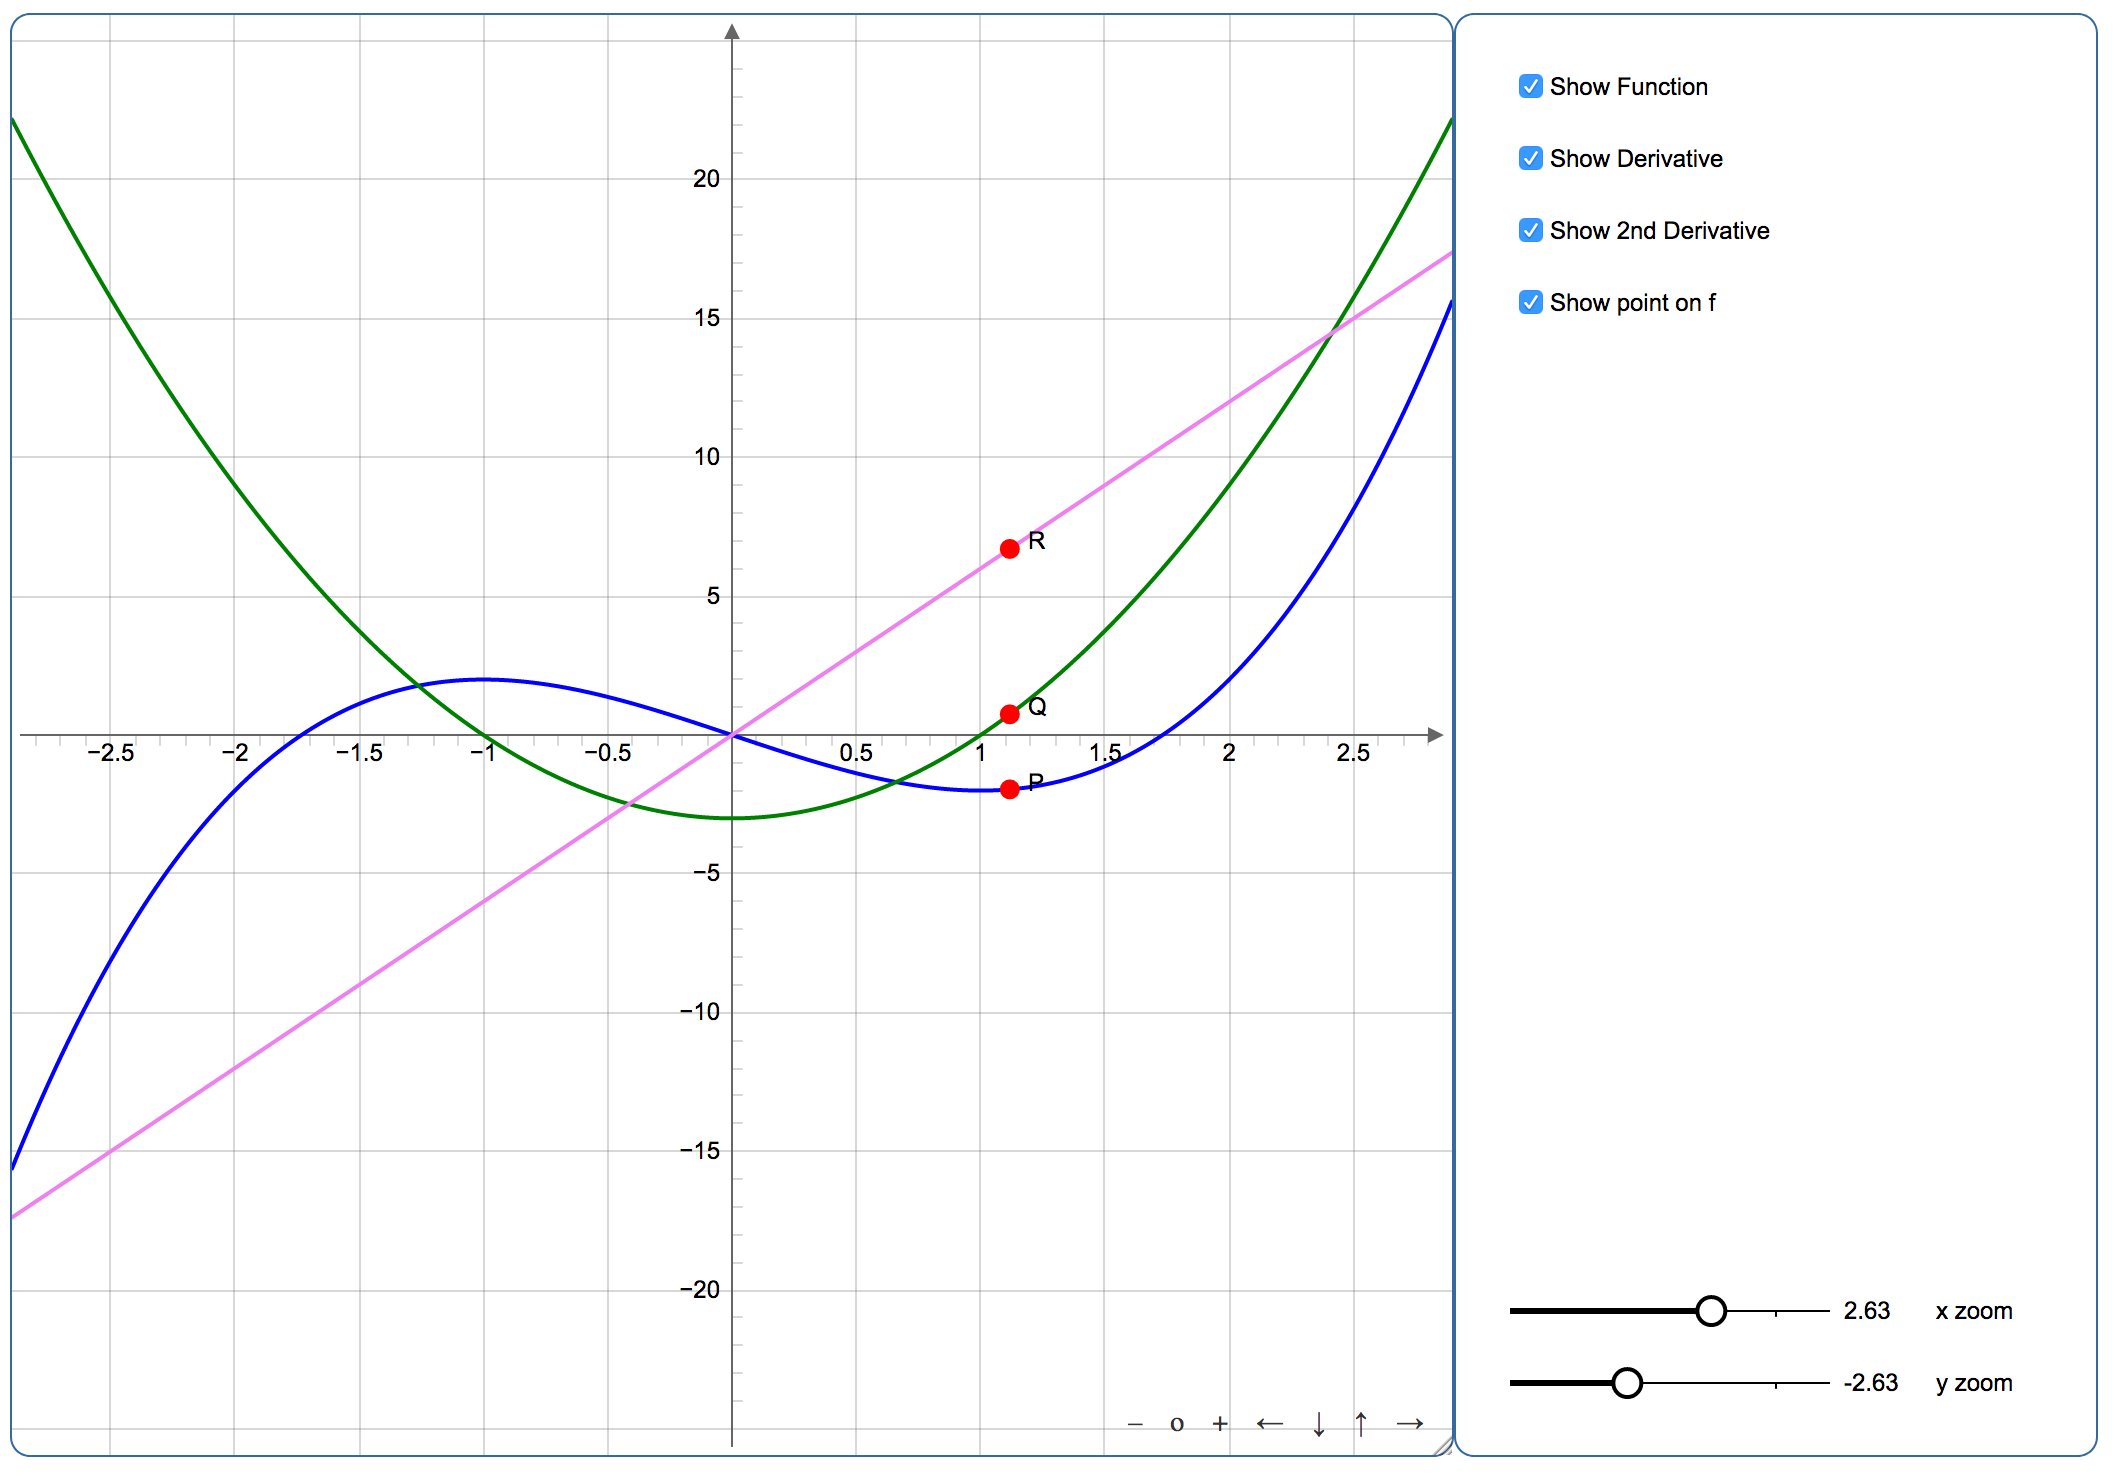
Curve Sketching
Demonstrates how the first and second derivatives can be used in conjunction in order to produce
graph of the original function.
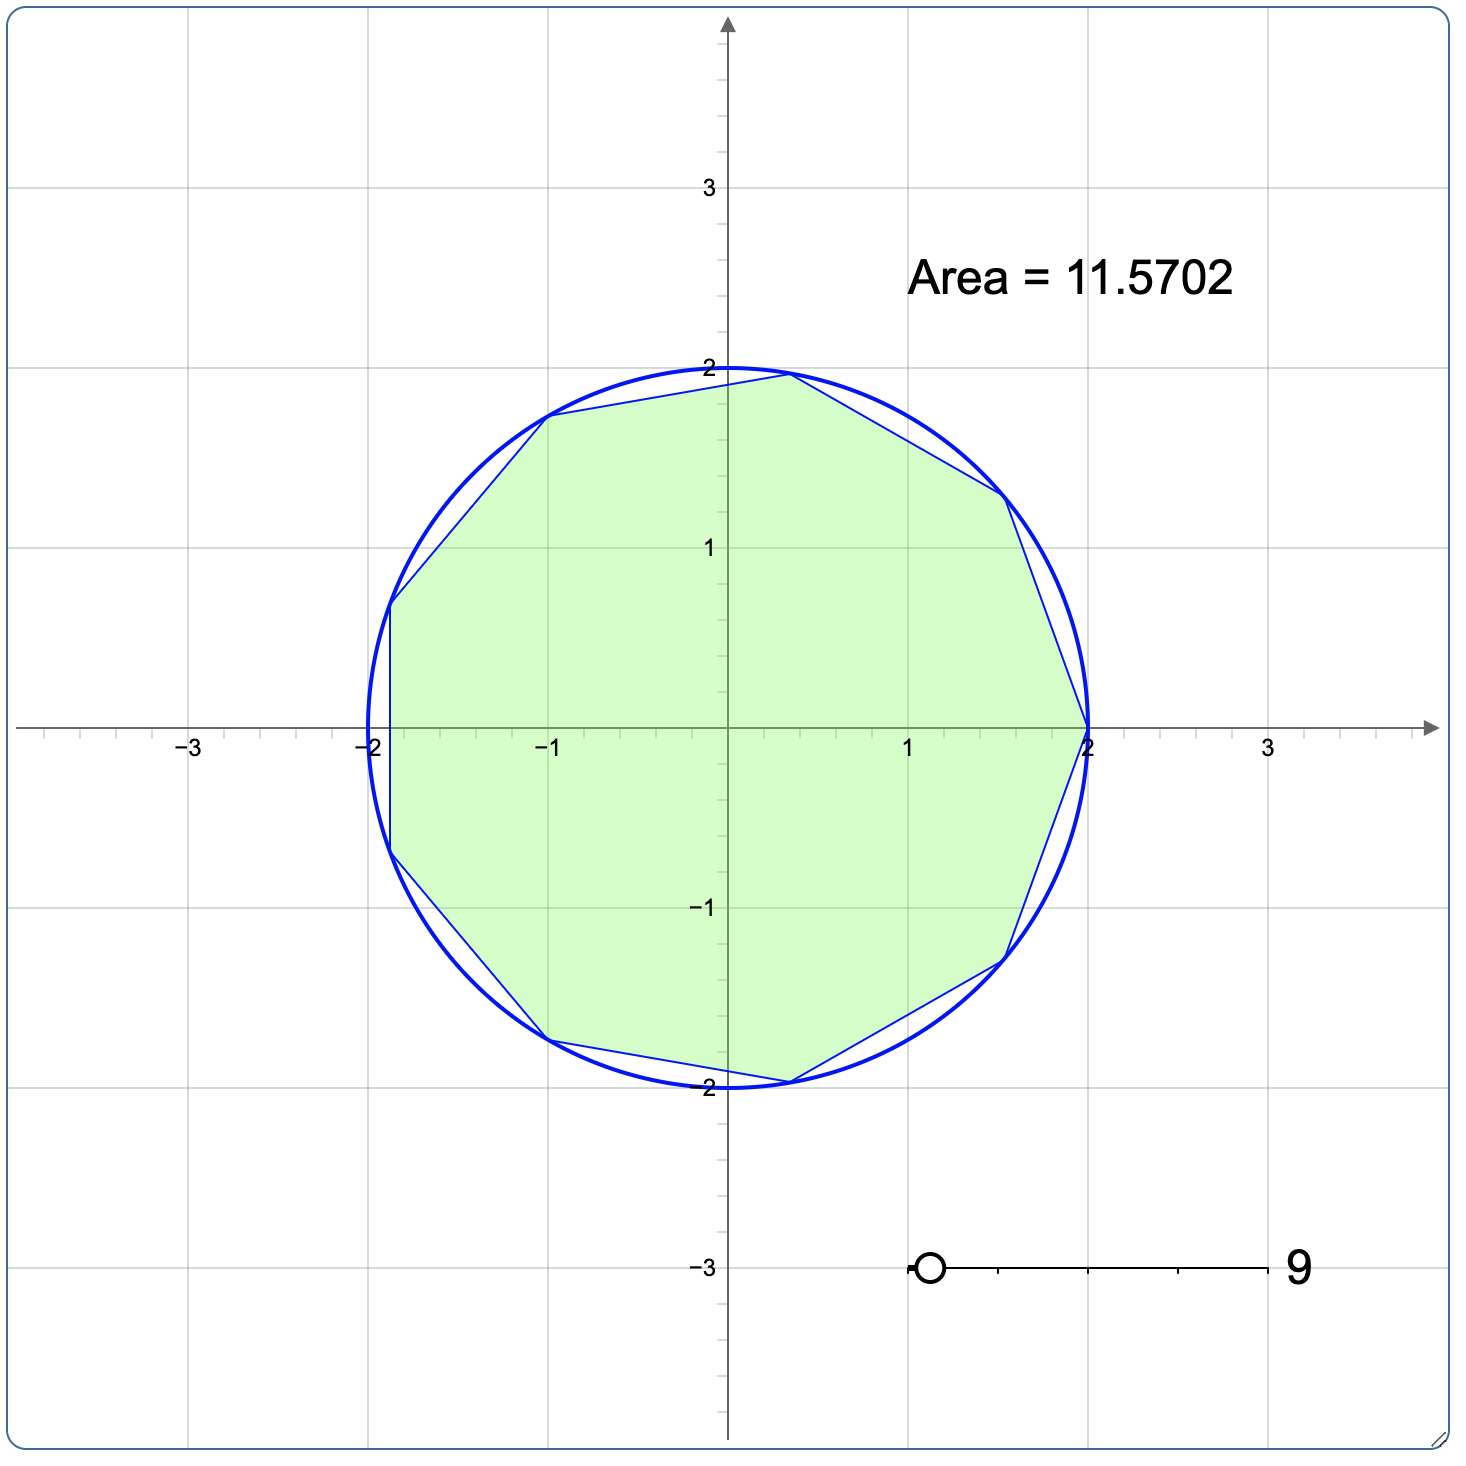
Area of a Circle
Demonstrates how the area of a circle can be approximated using inscribed regular polygons.
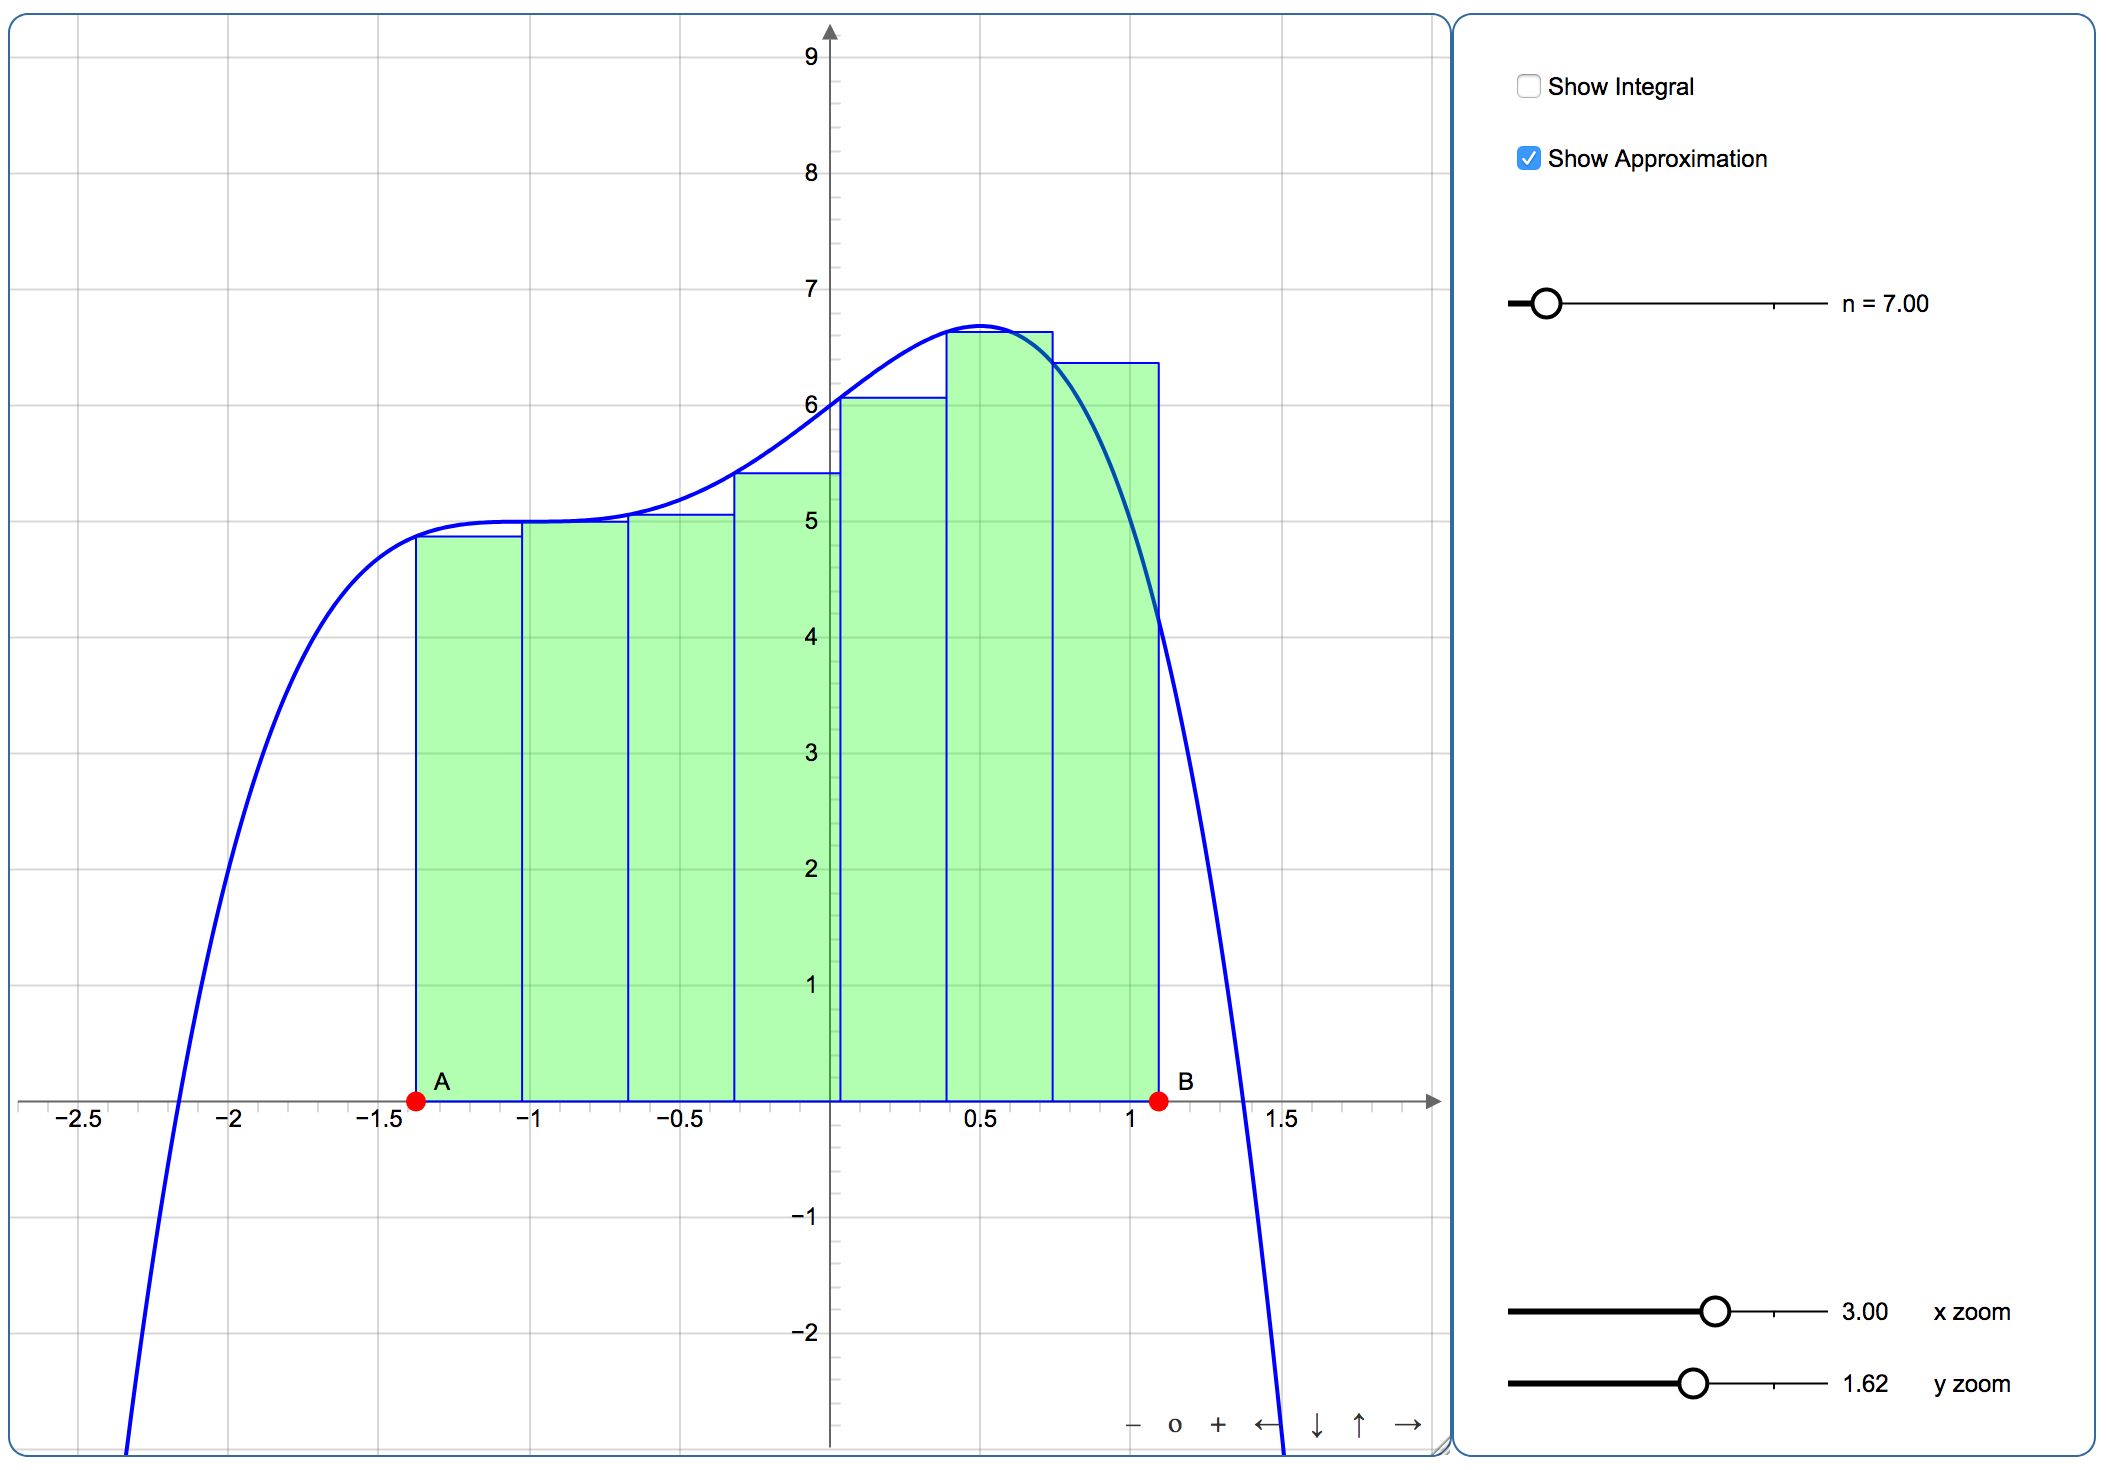
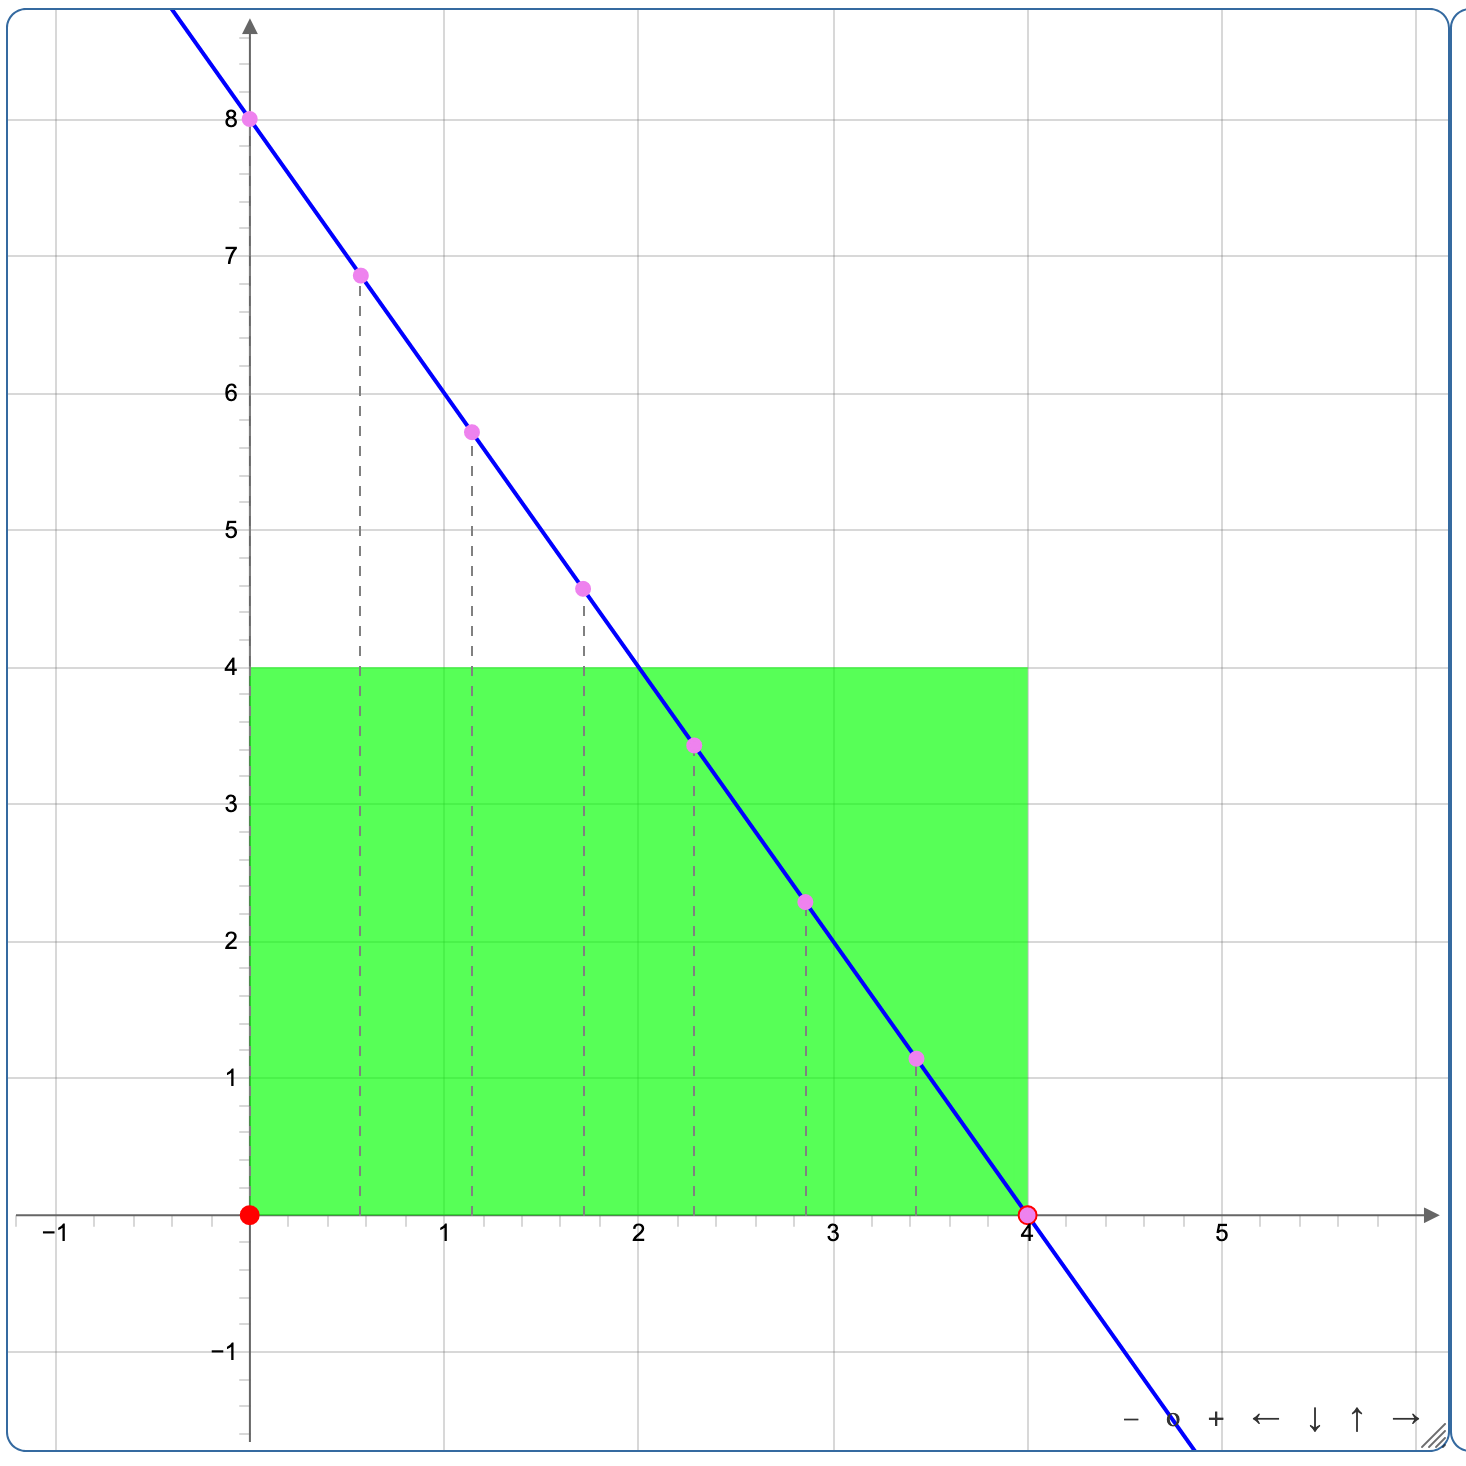
Integrals and Approximations
Demonstrates how to approximate the area under a curve using either left endpoint rectangles, right endpoint rectangles,
lower sums, upper sums, midpoint rectangles, trapezoids or parabolas. Compares the approximation to the exact area under the curve.
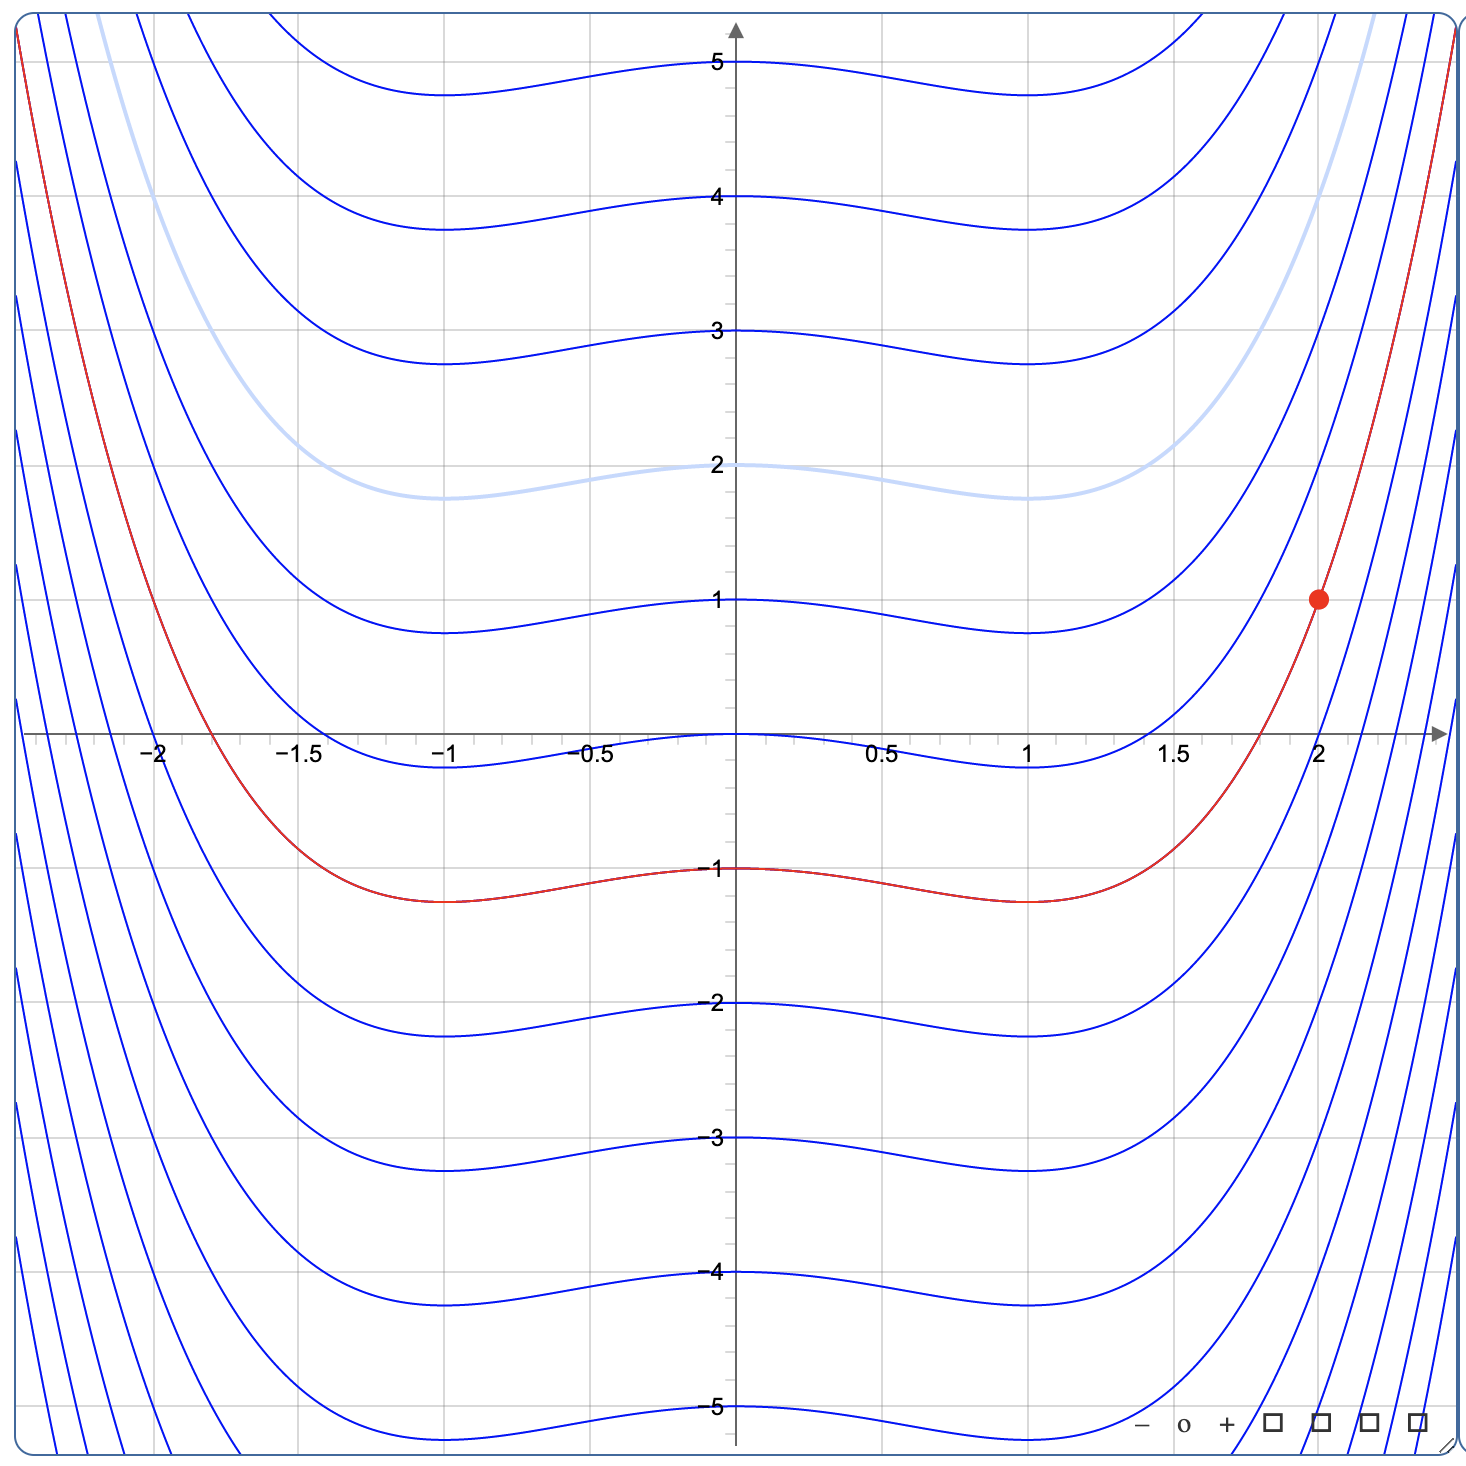
General and Particular Solutions
Demonstrates the concept of a general solution to a differential equation and a particular solution.
Definite Integrals
Calculates a definite integral between two different functions so that properties of definite integrals can be displayed.
Average Value of a Function
Demonstrates how the average value of a function is computed using limits and allows users to take a guess at what the average value of a function is to compare to the real result.
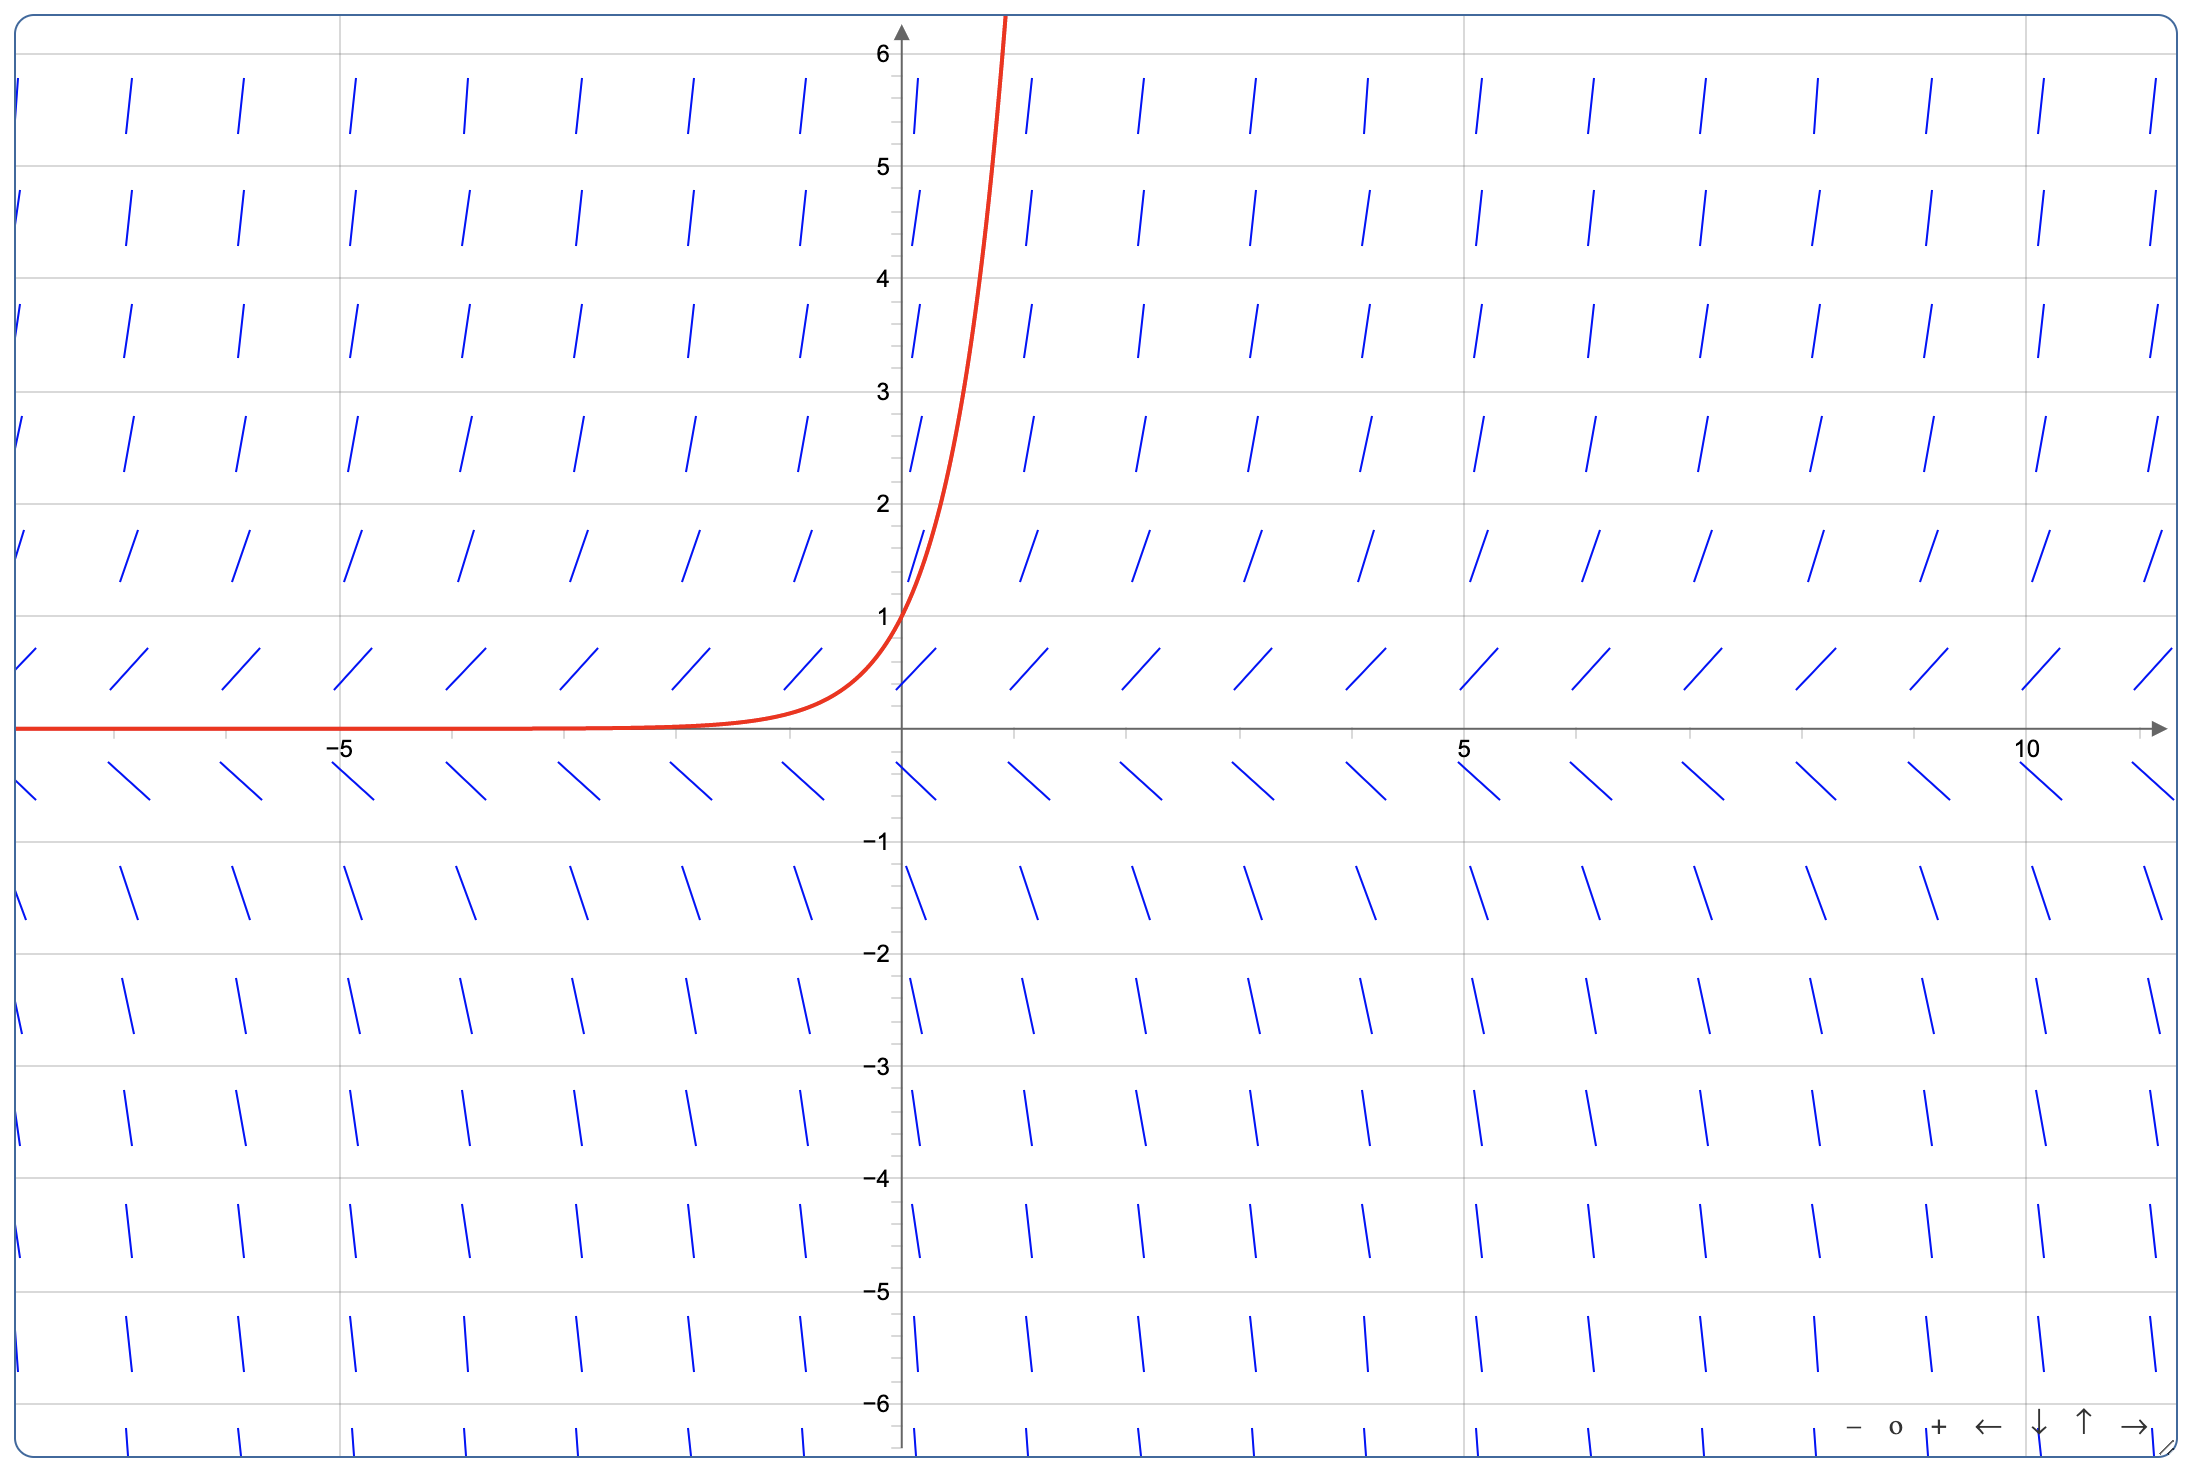
Slope Fields
Allows the user to input a first degree differential equation in order to see the slope field associated with it. A function
that represents a particular solution can also be drawn so that students can see the relationship between the particular and general solutions.
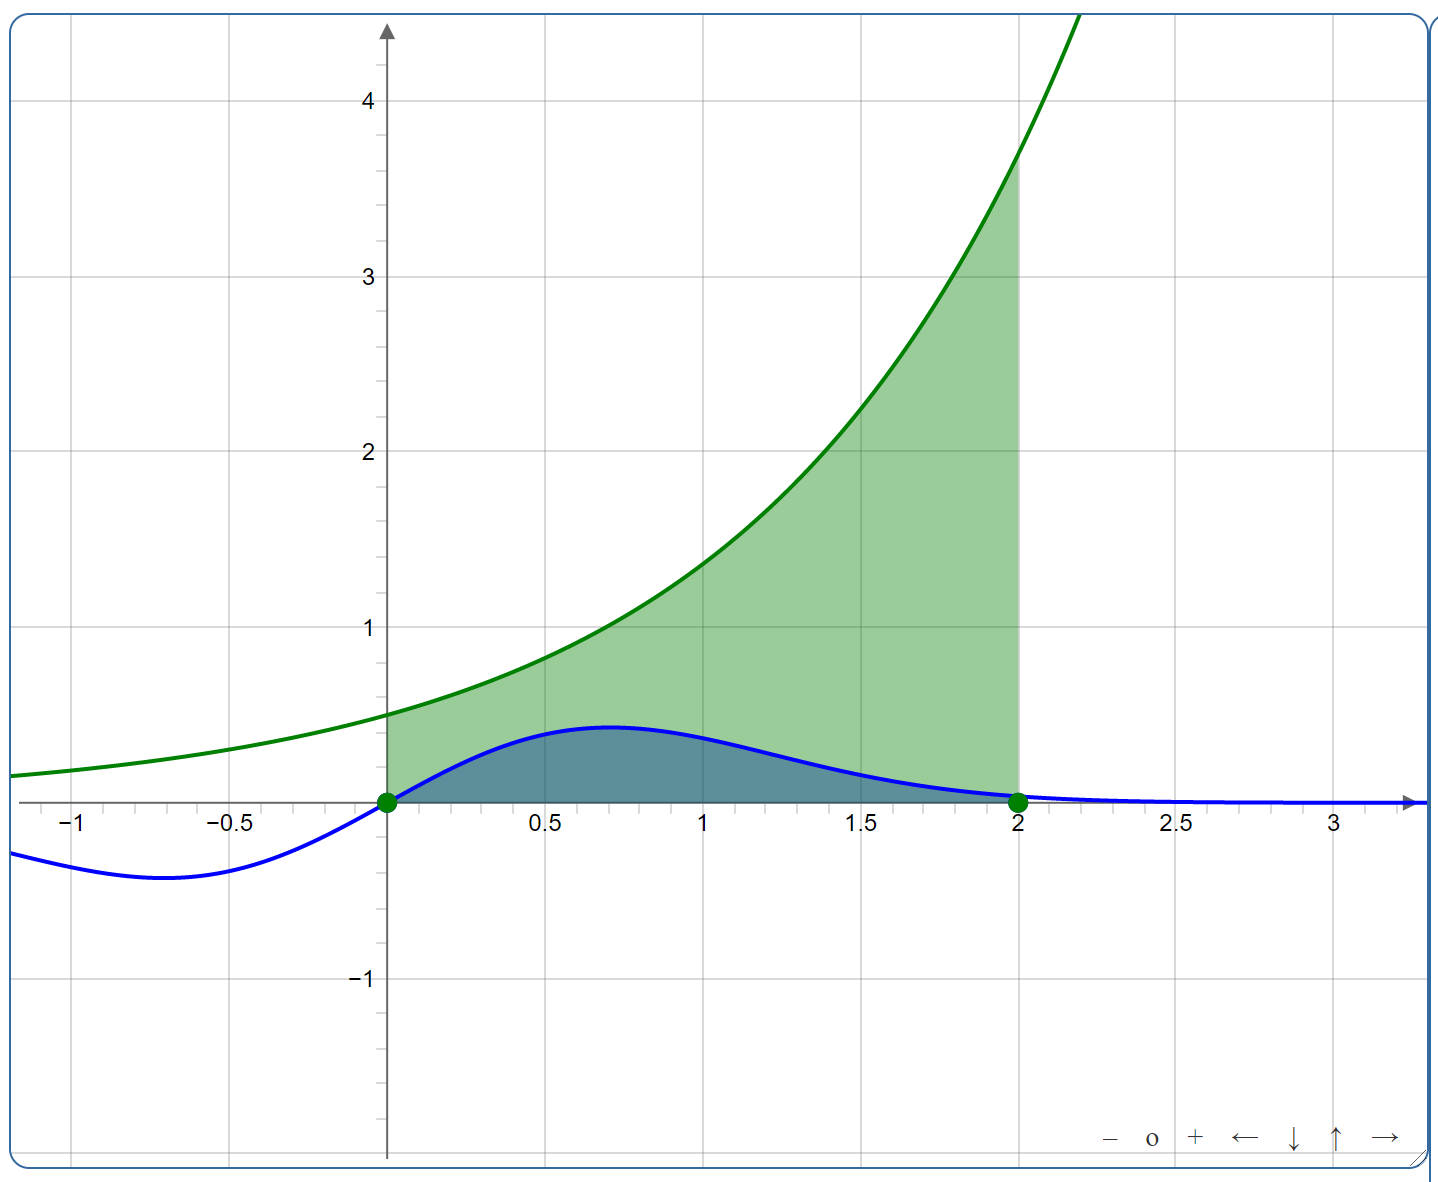
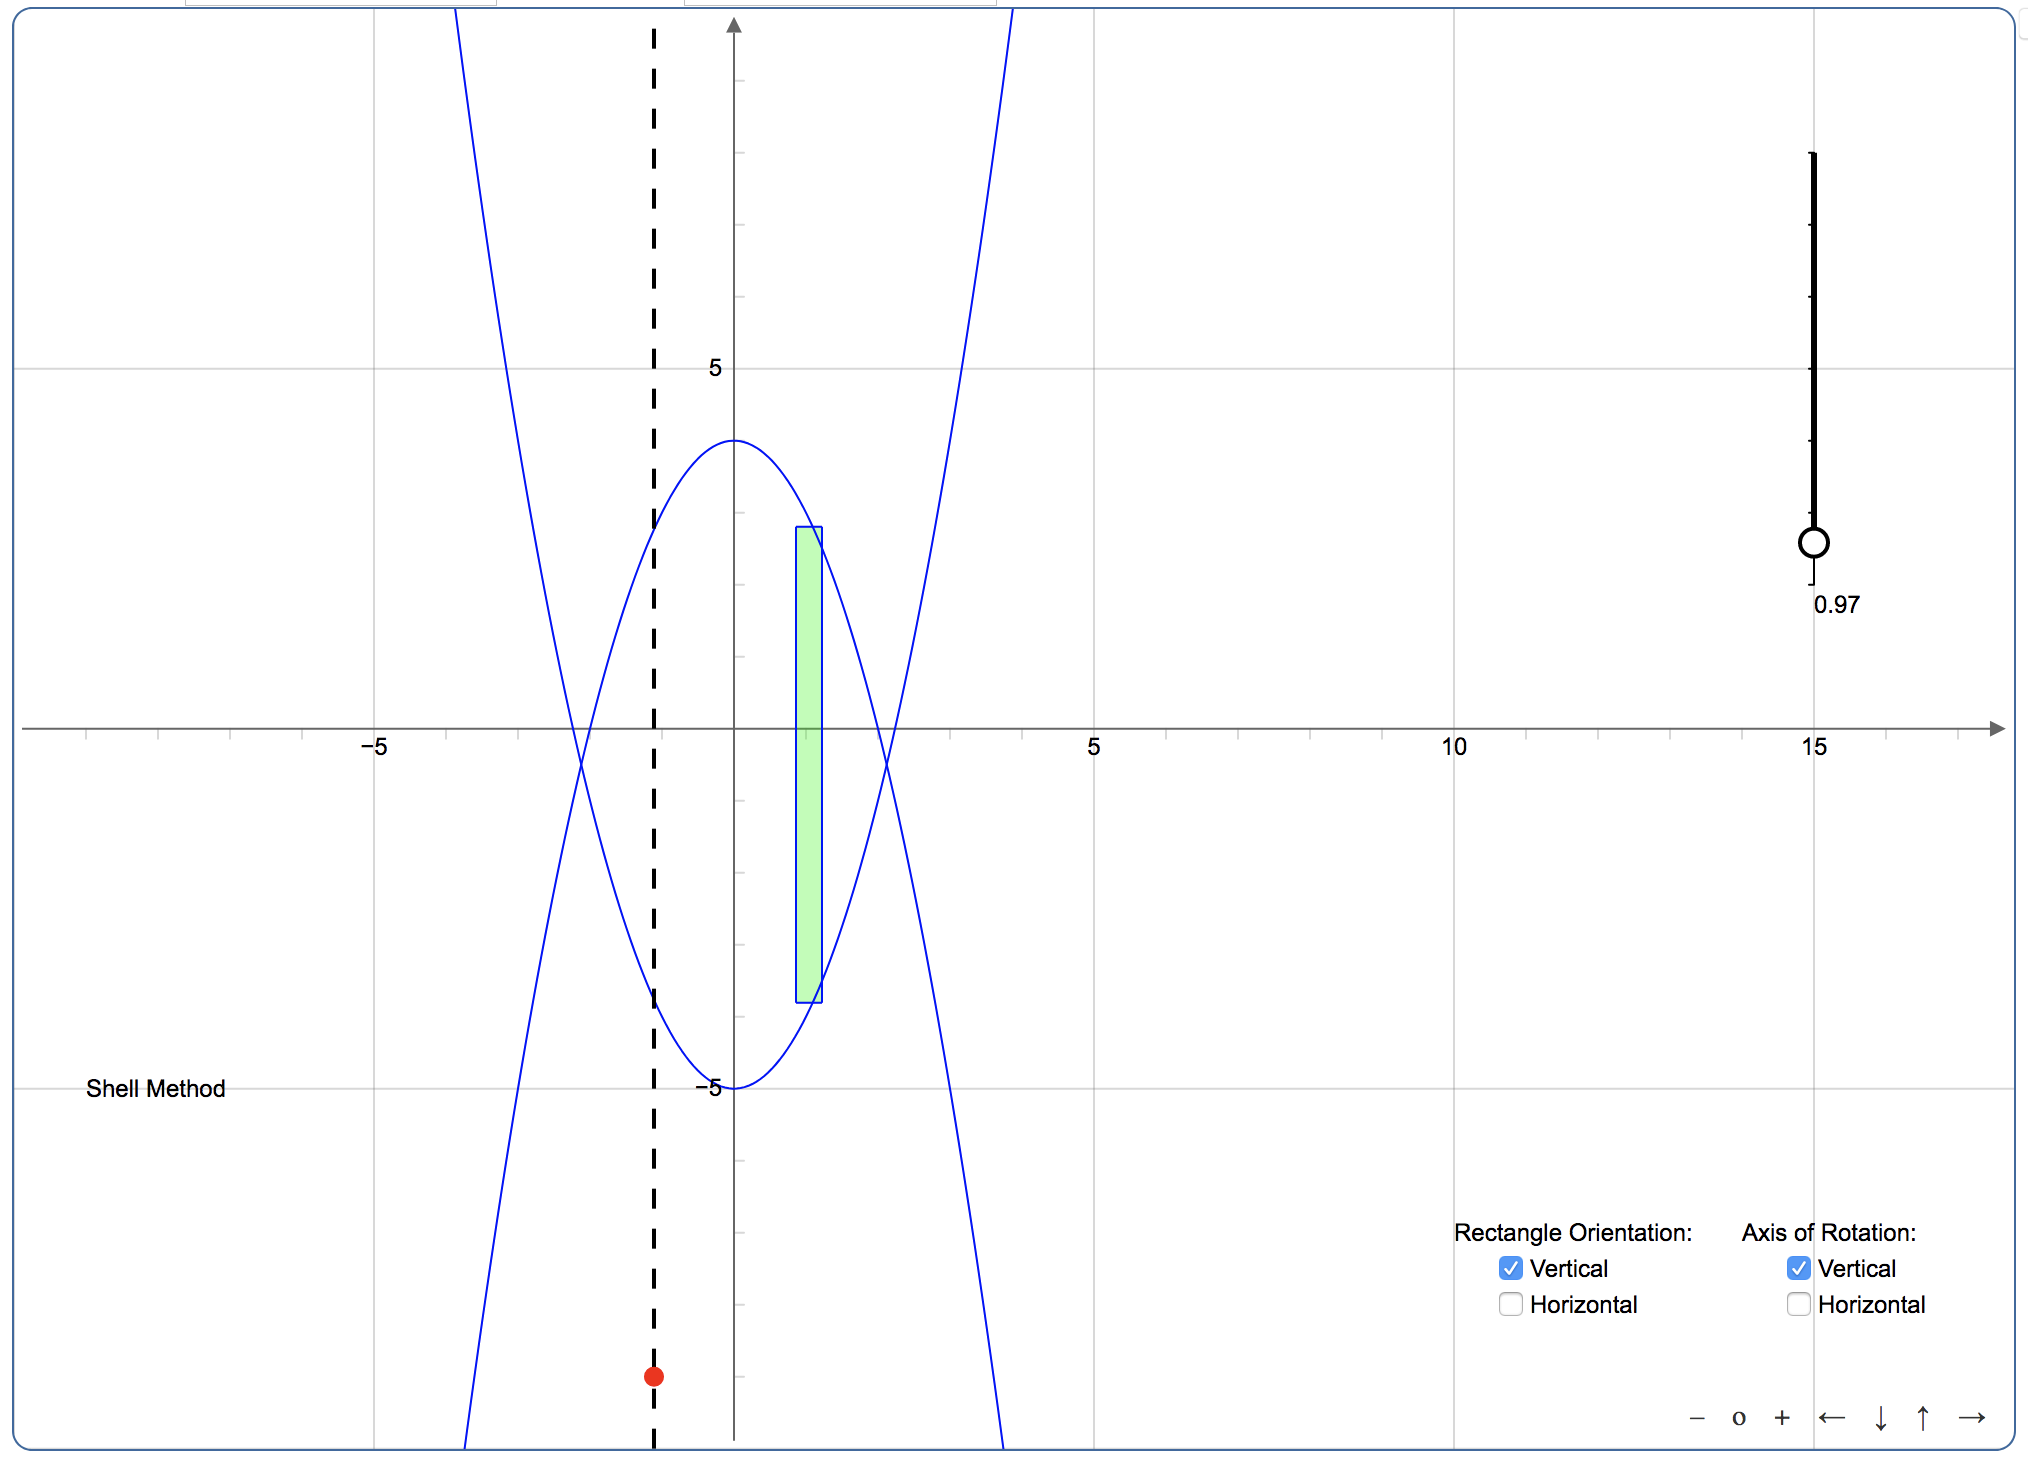
Area Between Curves
Allows user to draw up to four boundary functions, and can either move a base rectangle within that region, or view
approximating rectangles within the region. The rectangles can either be oriented vertically or horizontally. A vertical or horizontal axis can also be
drawn to help illustrate the disk and shell methods.
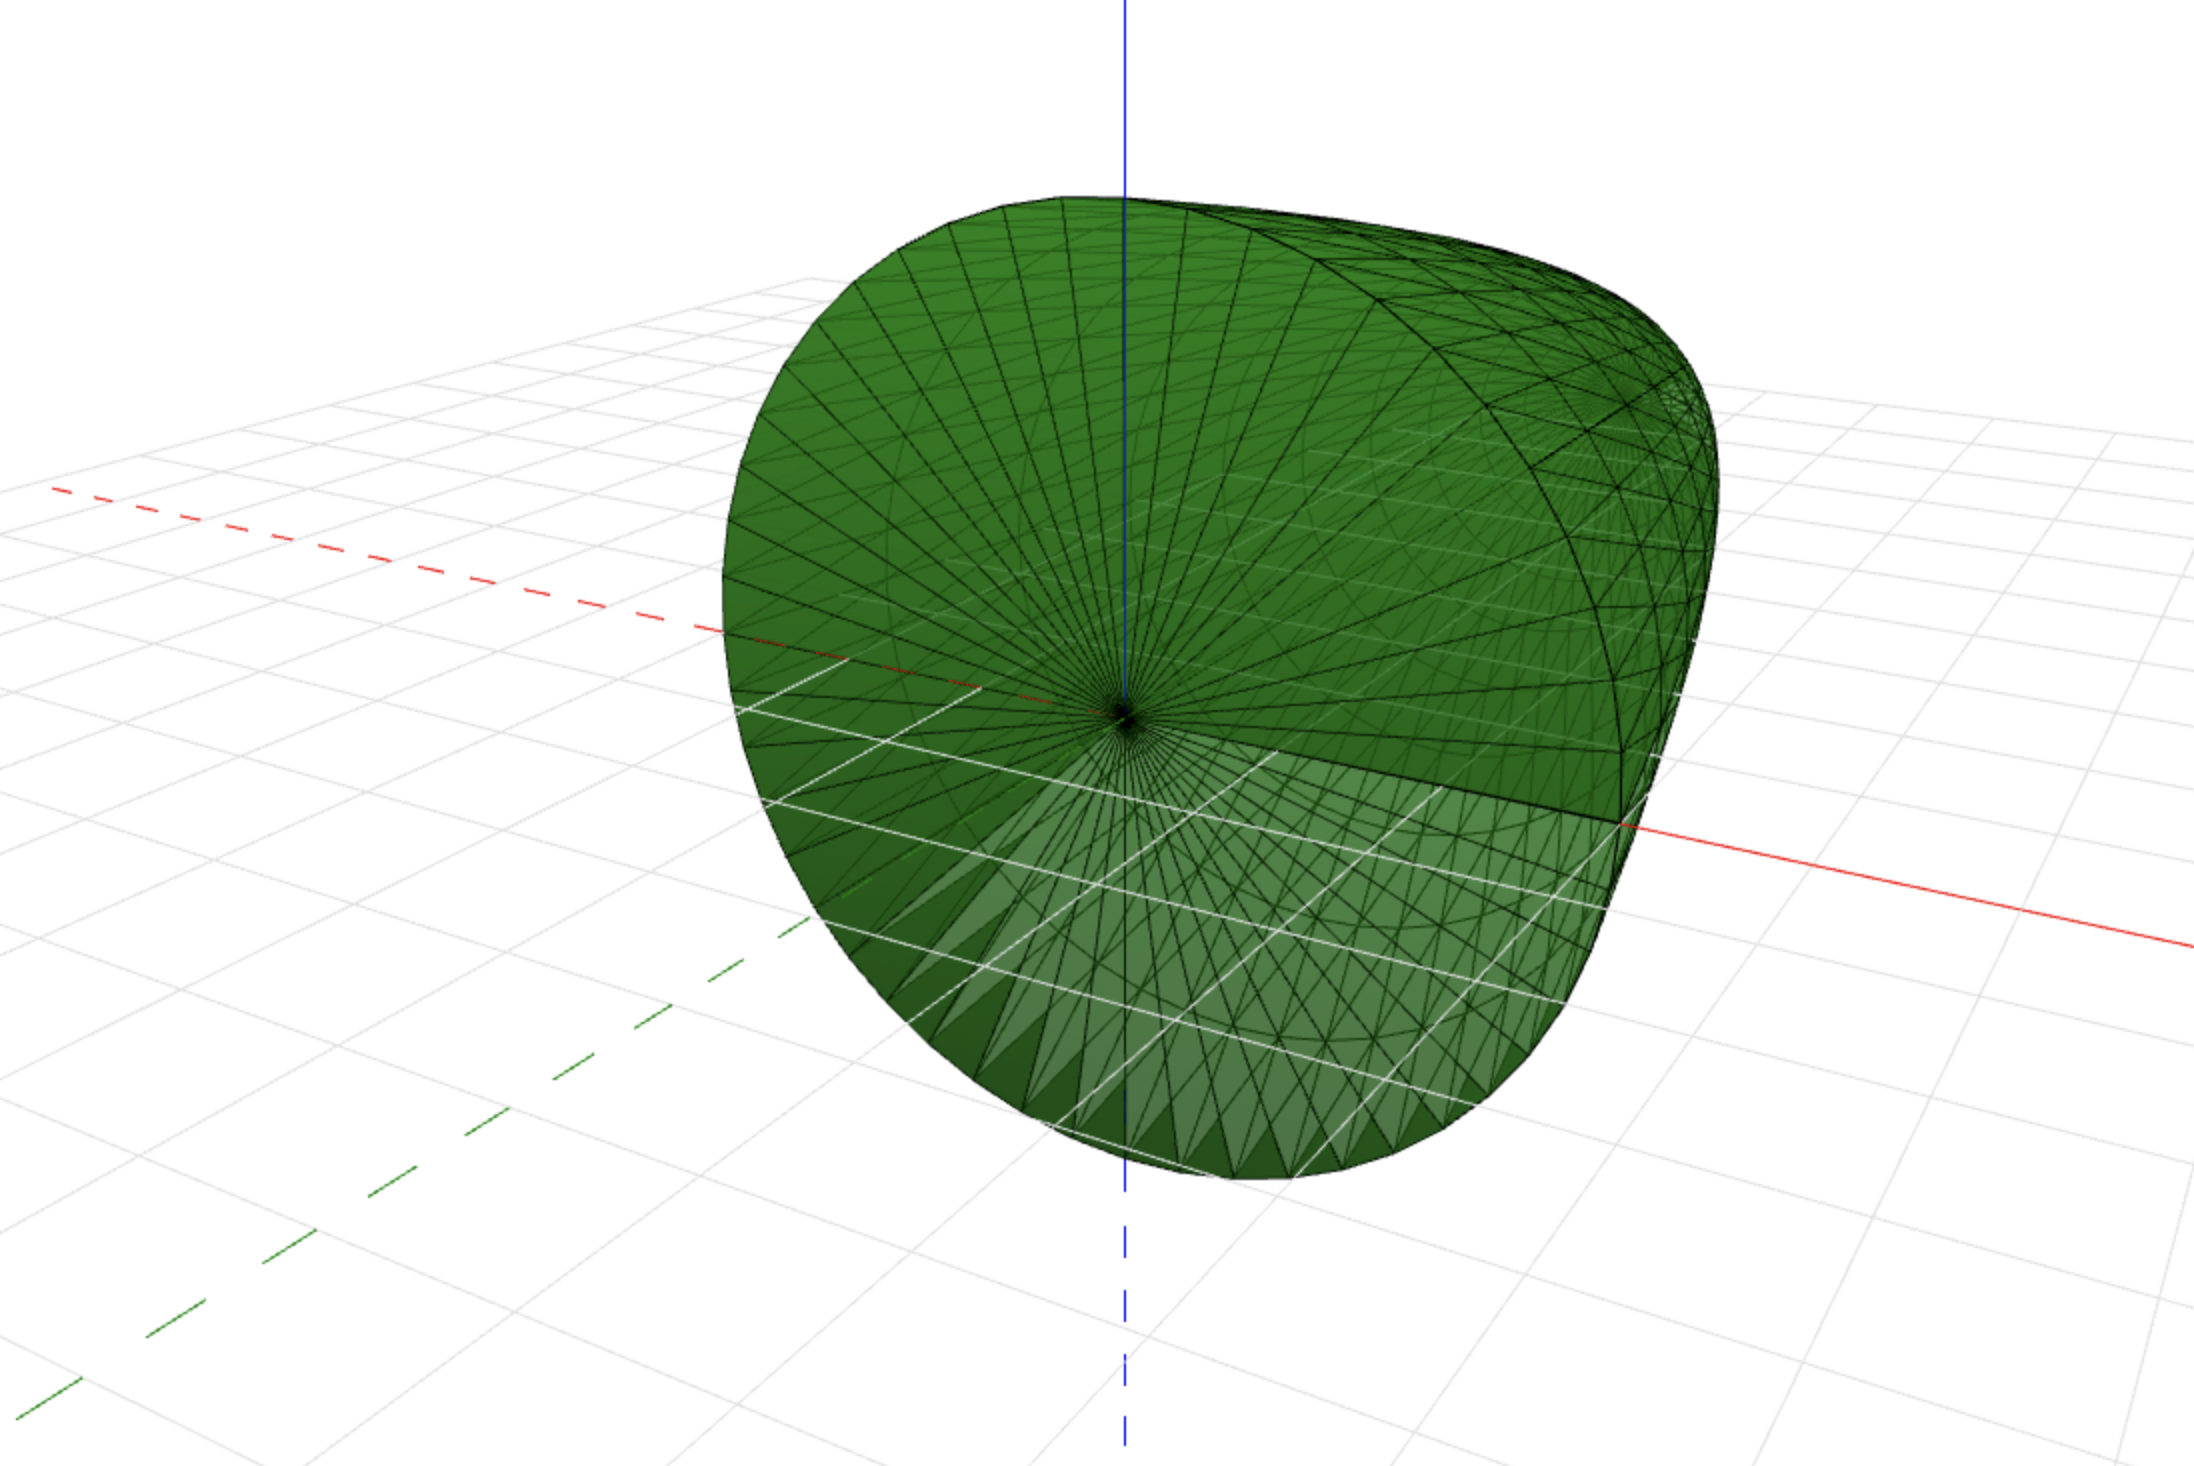
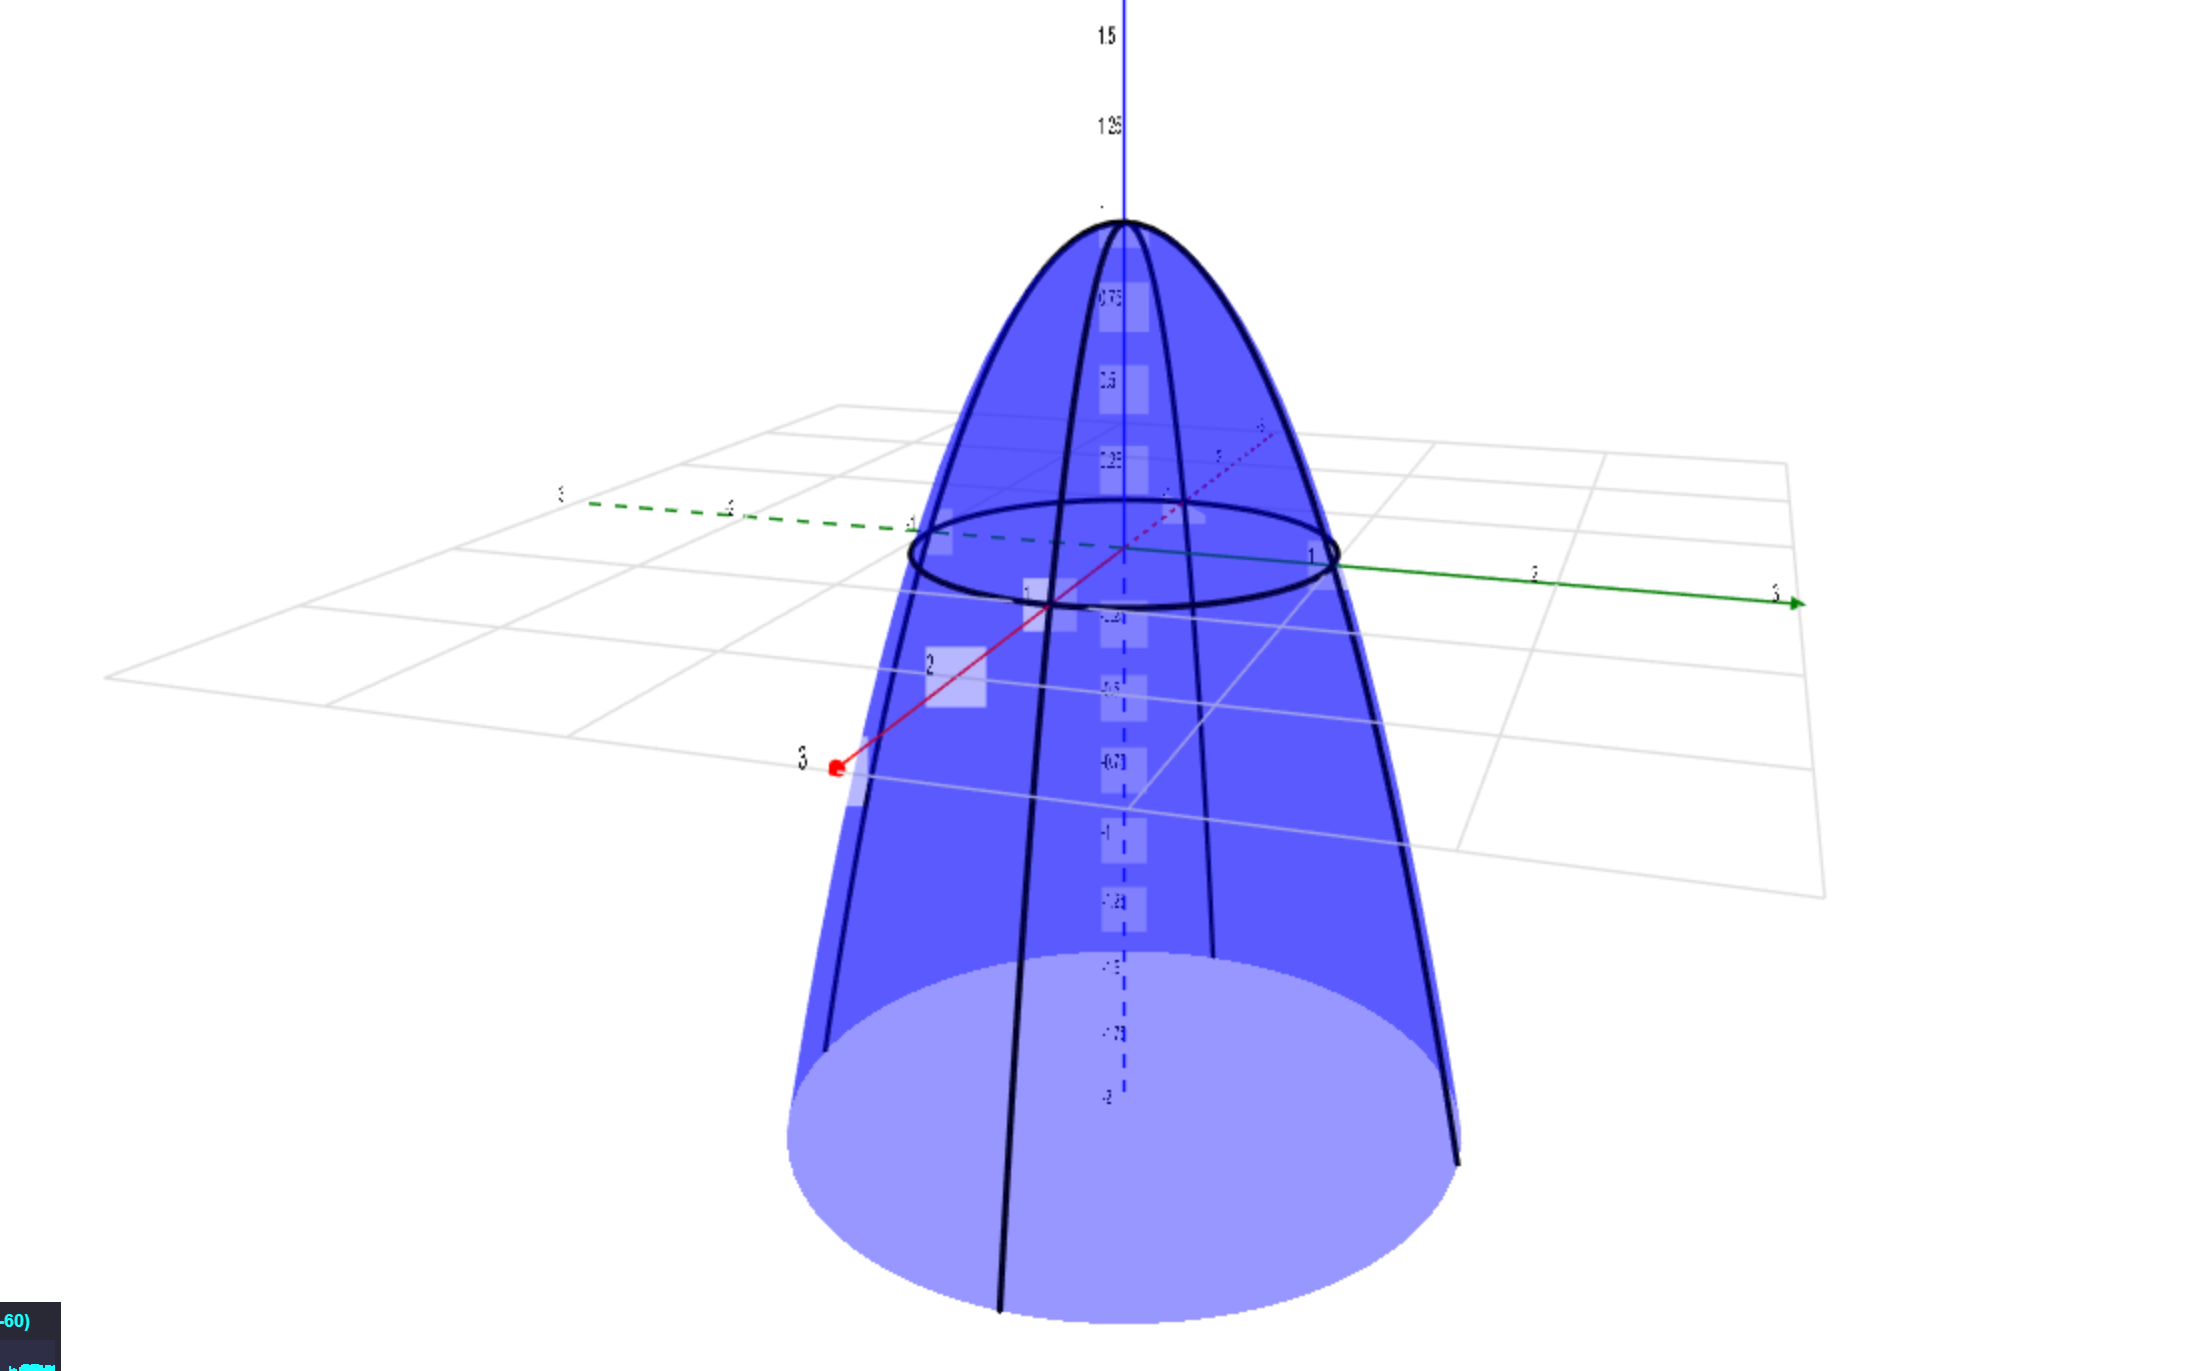
Disks and Shells
Demonstrates the object created in 3D by rotating a user-defined path in the xy plane around the x or y axis.
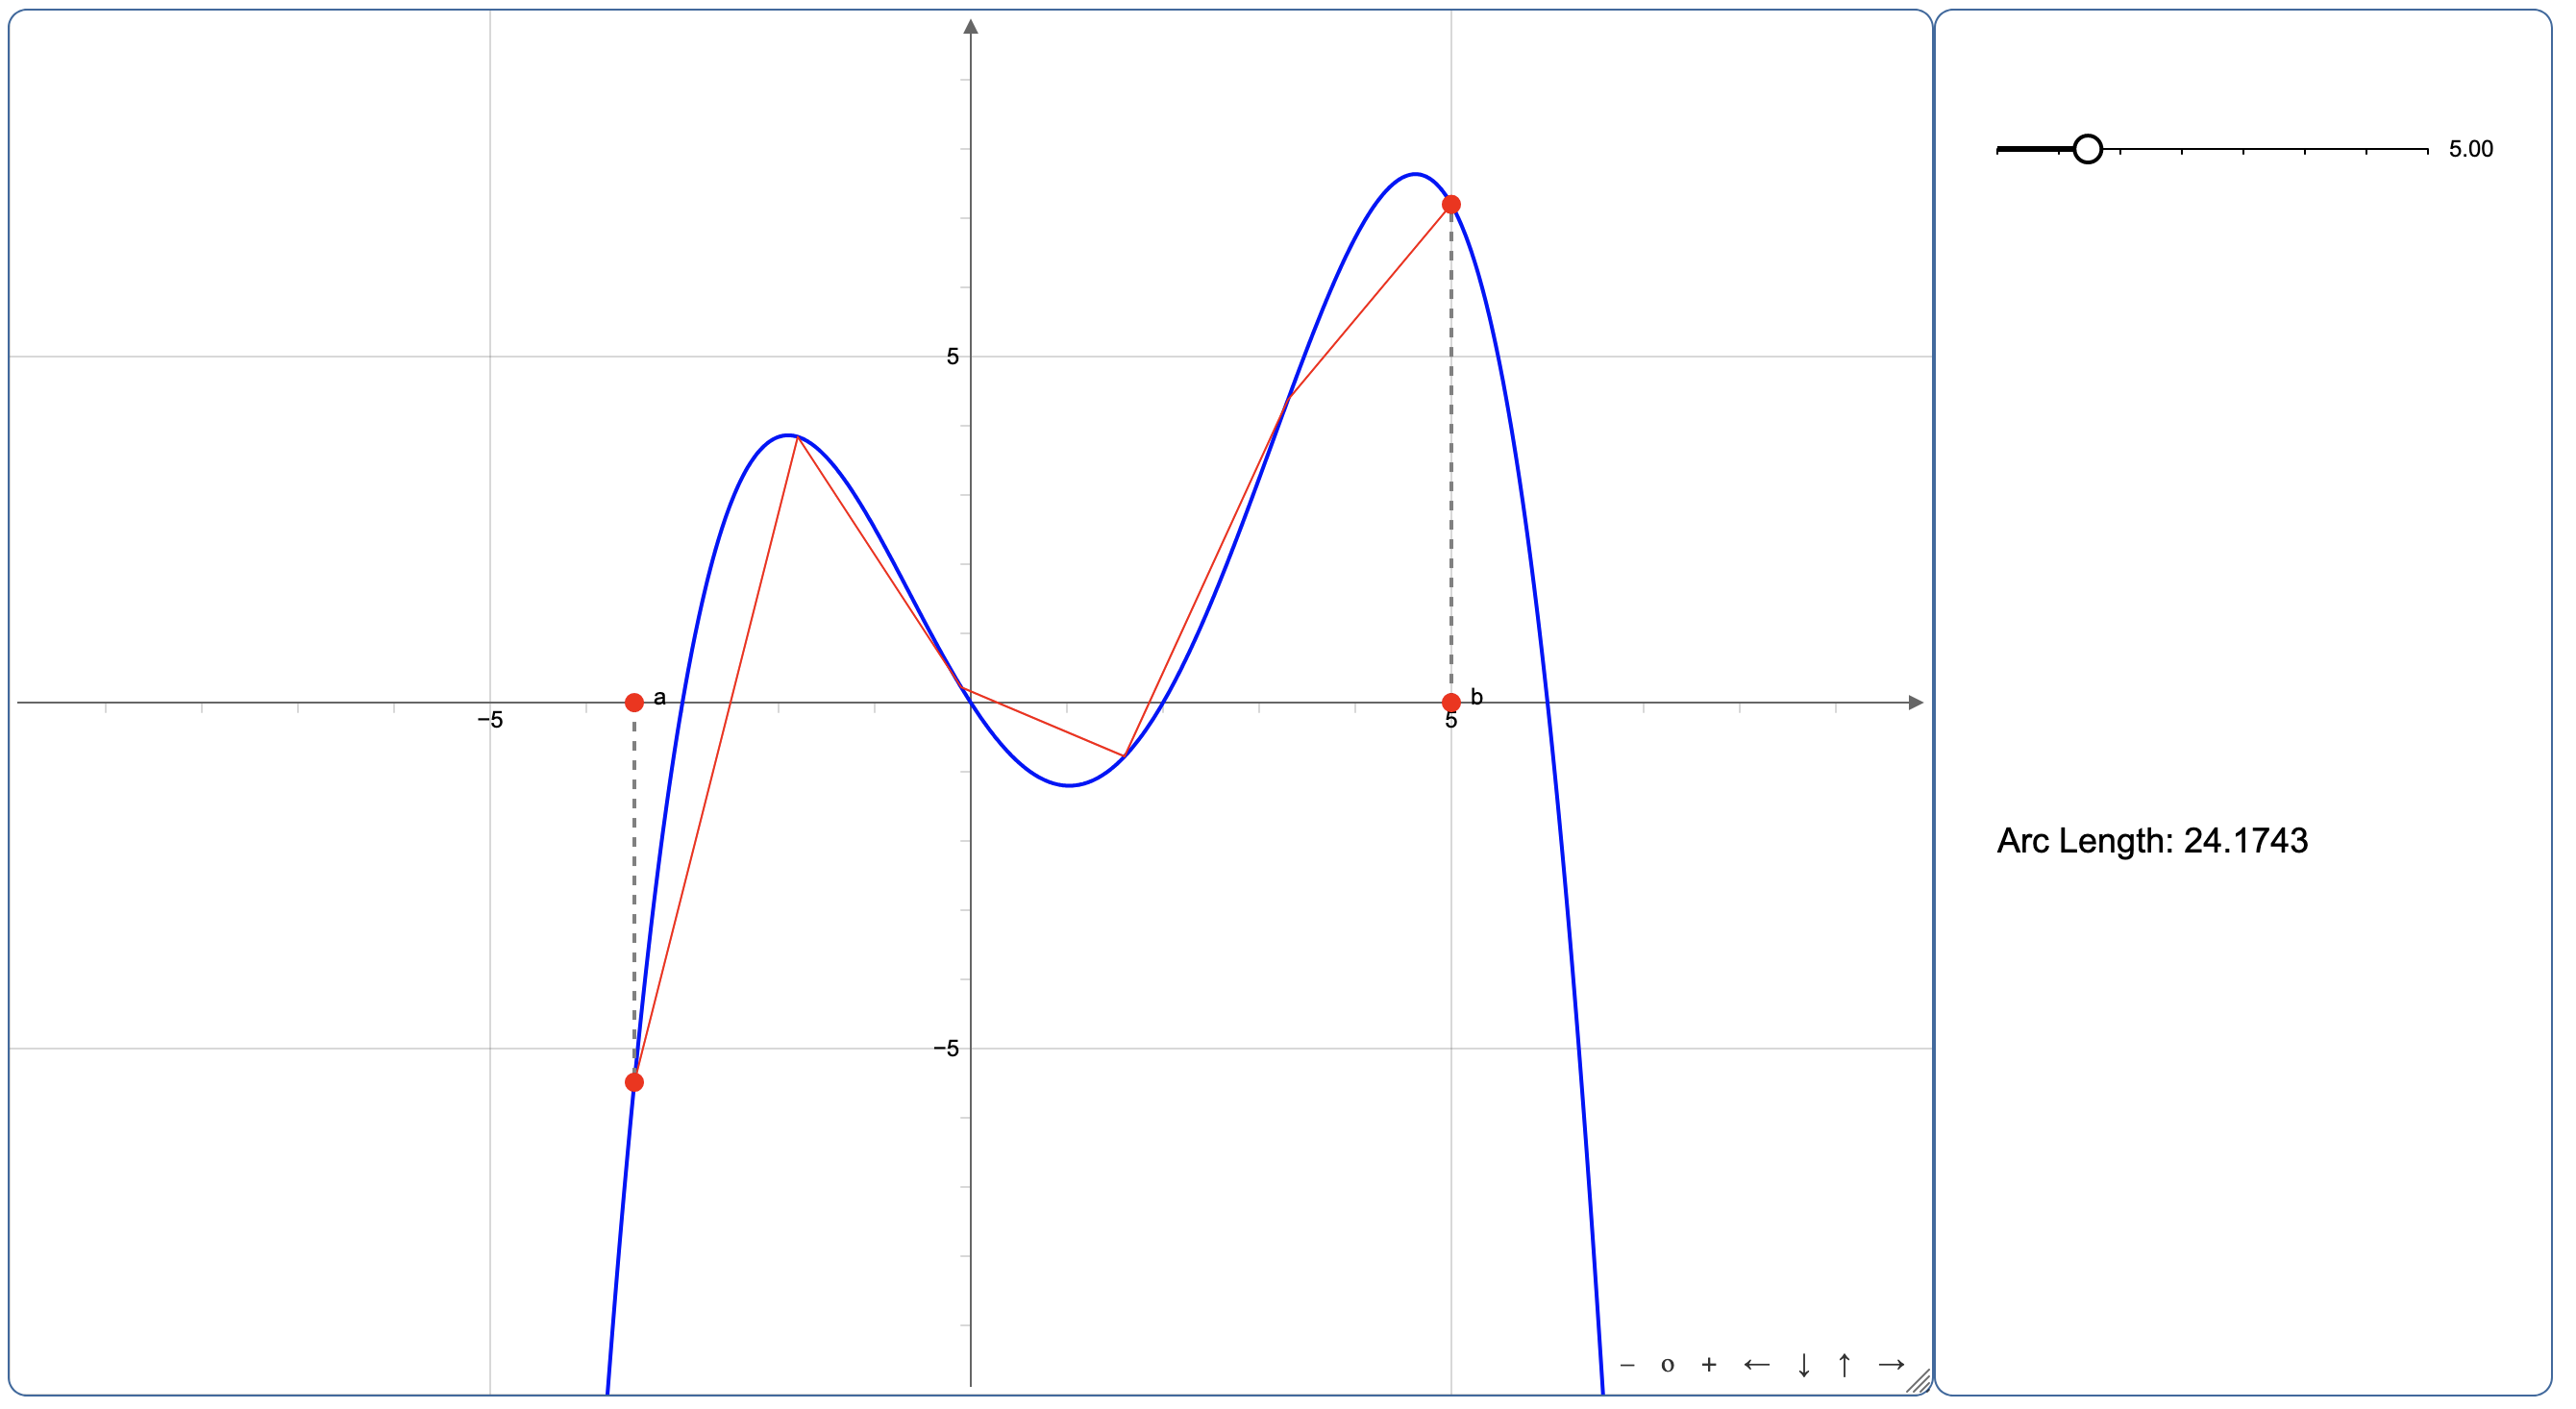
Arc Length
Demonstrates how the approximation of arc length is calculated along a function on a given interval.
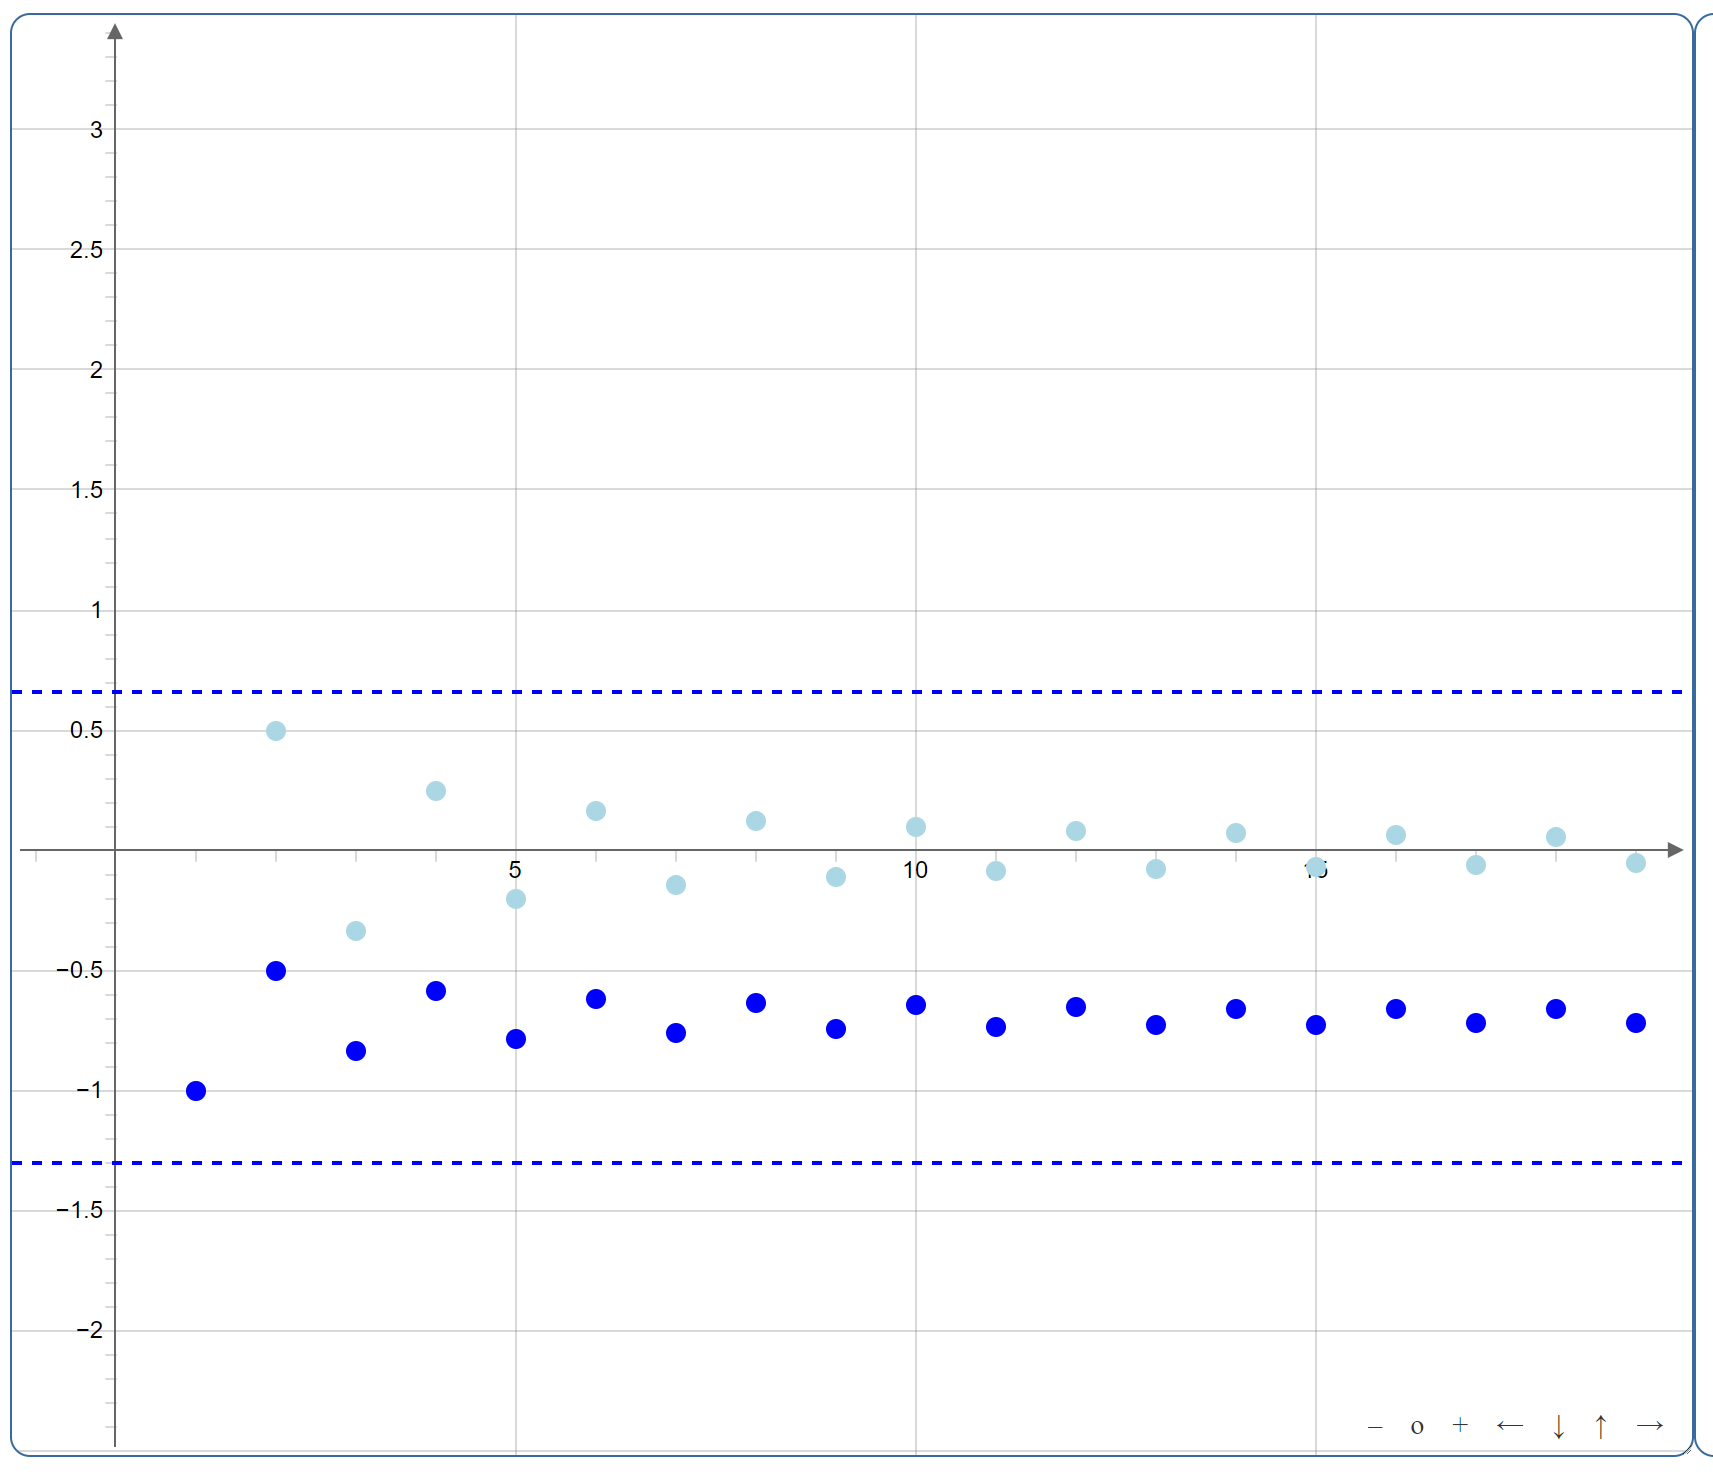
Sequences and Series
Allows the user to graph sequences and partial sums of series in order to visually see how some series converge and others diverge. Allows
comparison tests to be used in order to see how these work as well.
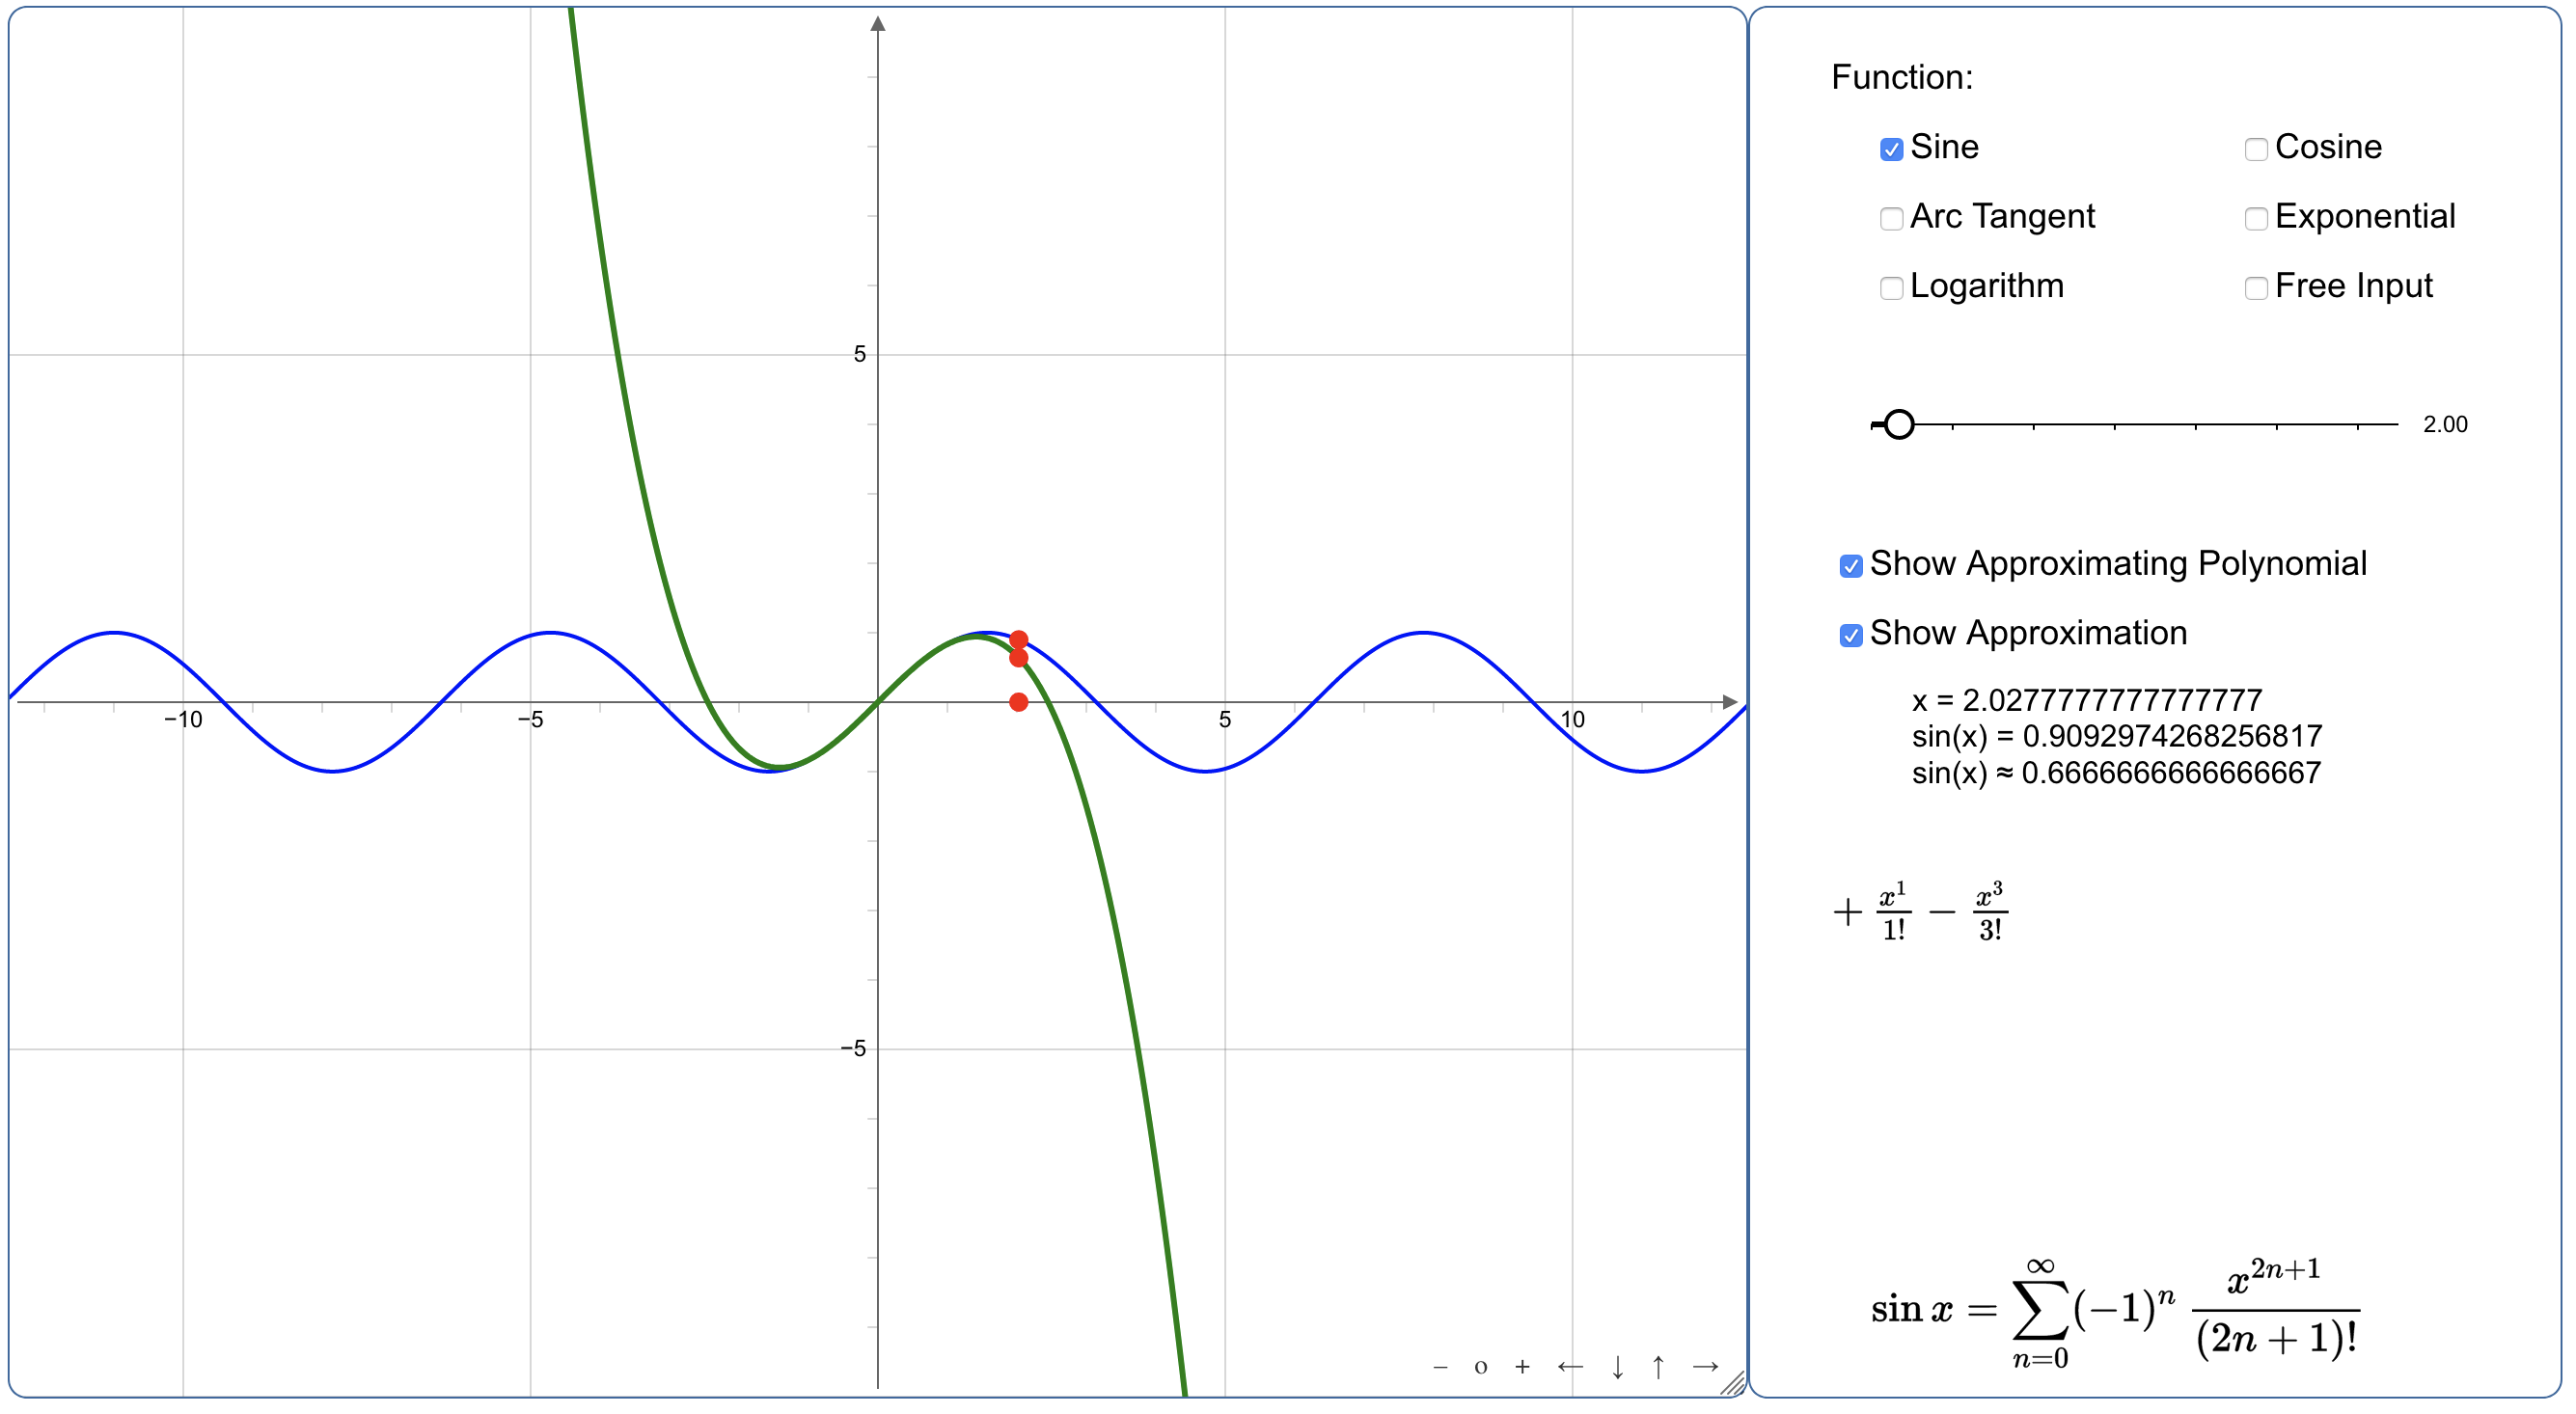
Taylor and MacLaurin Series
Demonstrates how Taylor and MacLaurin Polynomials can be used to make approximations to transcendental functions.
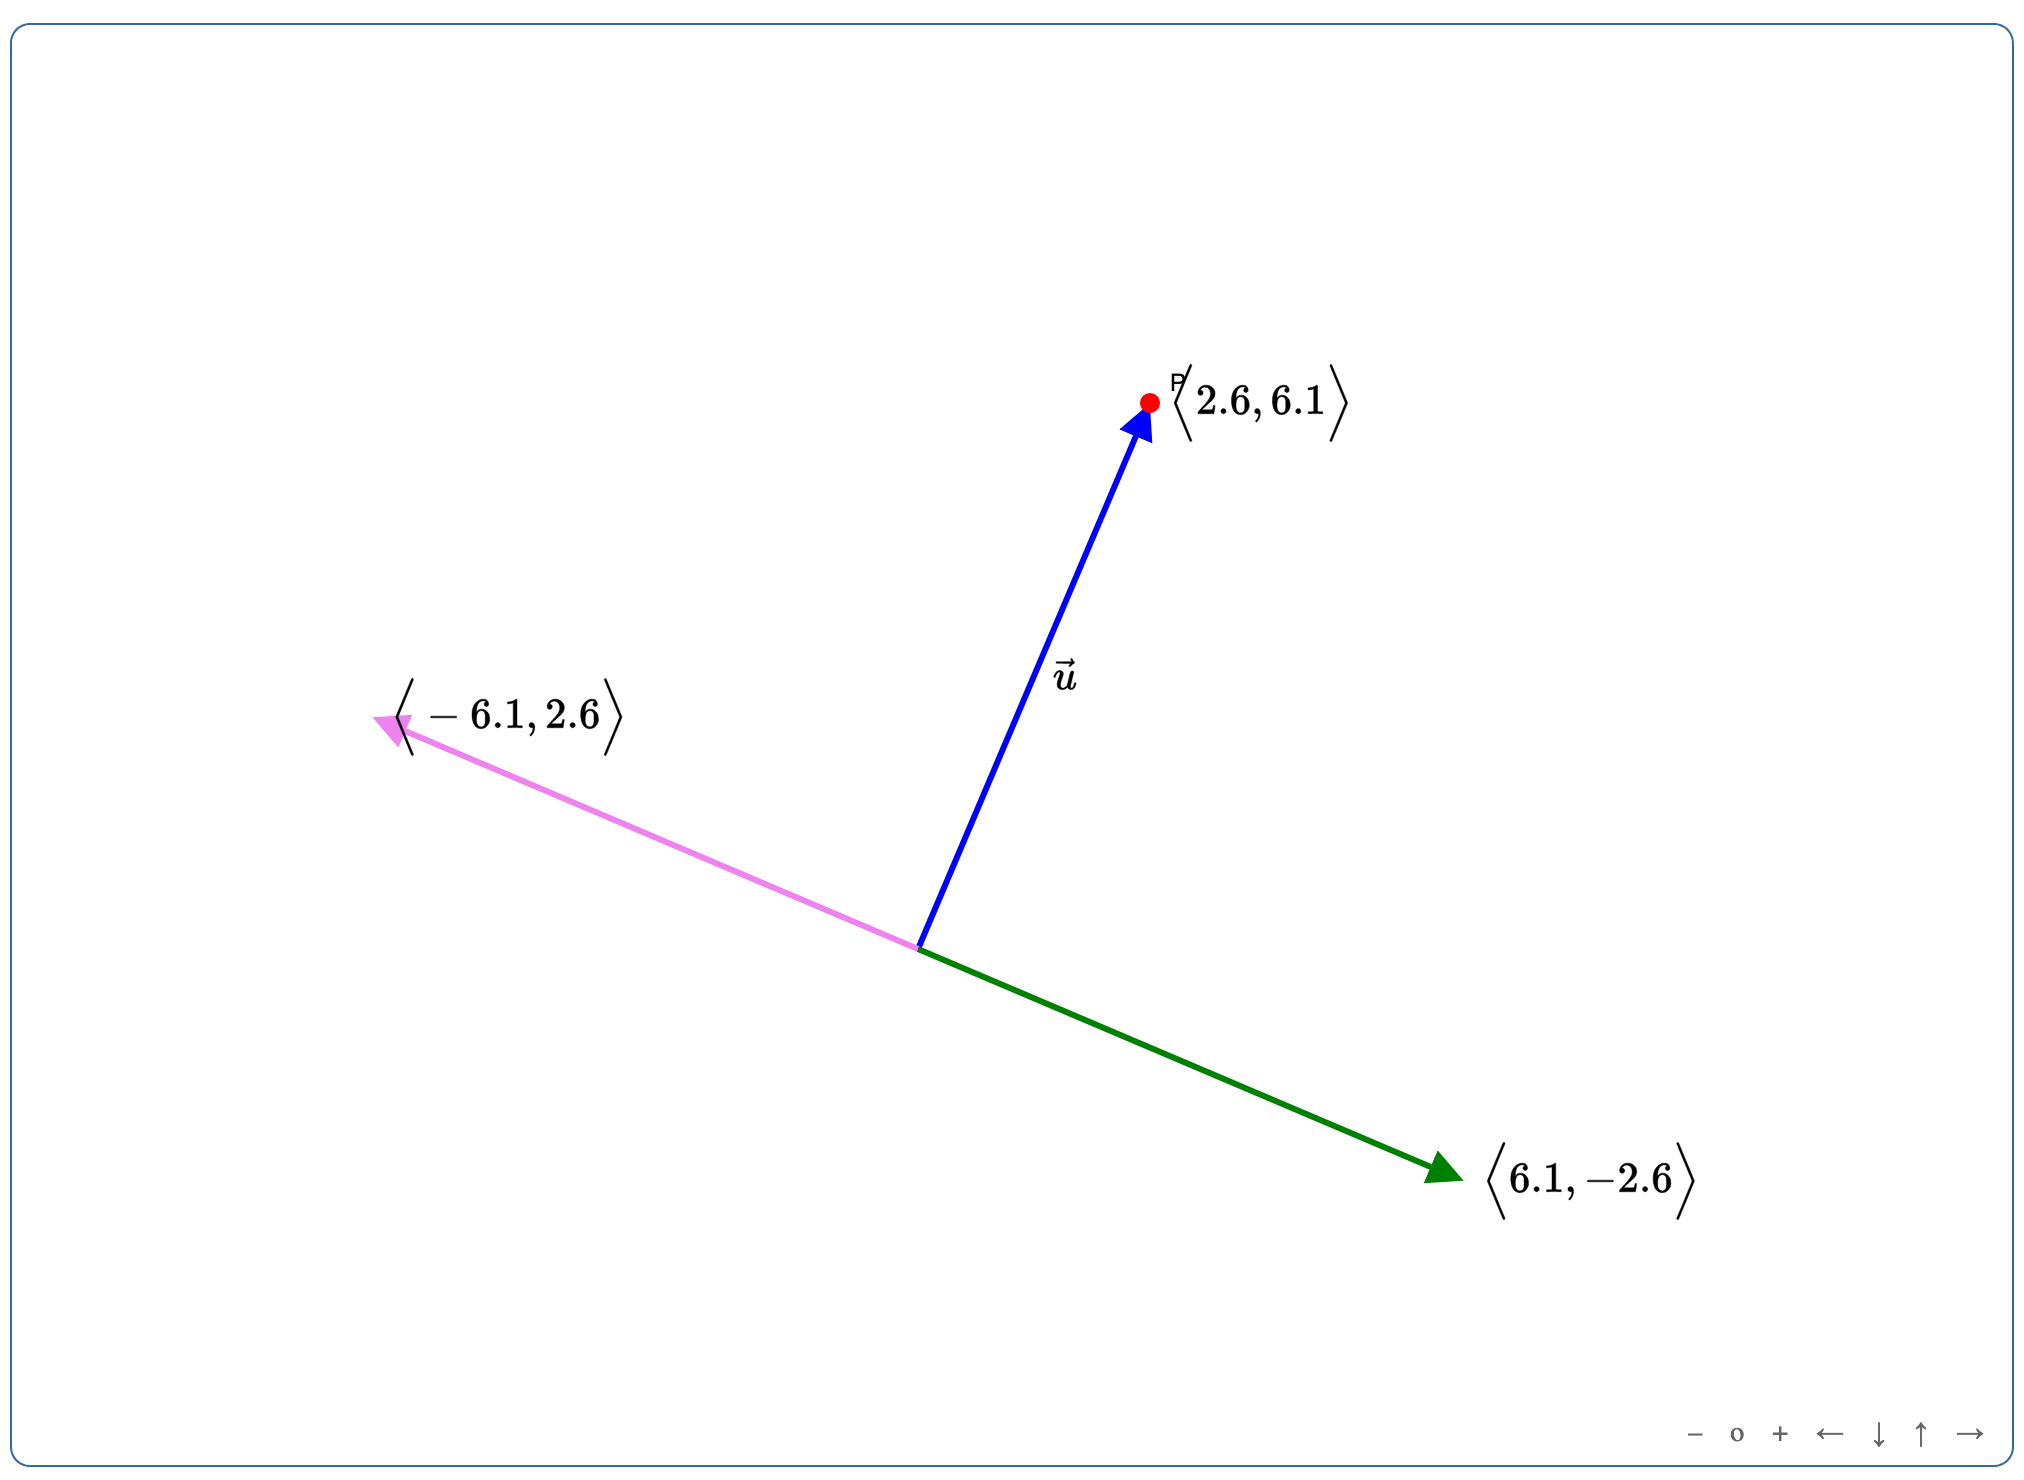
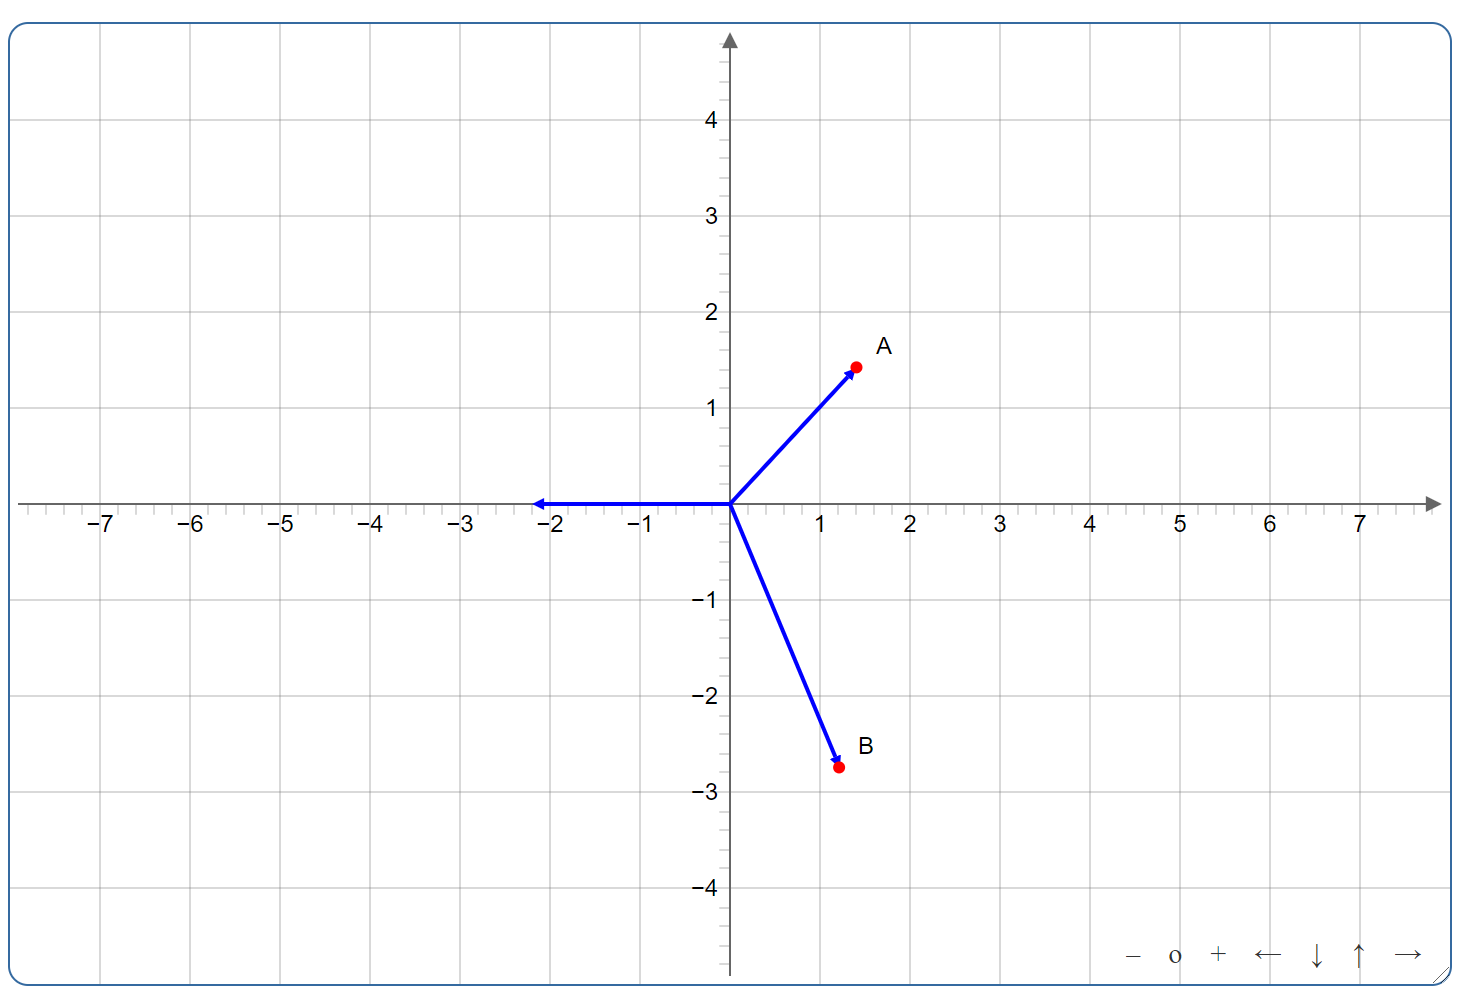
Vector Rotation
Demonstrates the effect of rotating vectors 90 degrees clockwise or counter-clockwise.
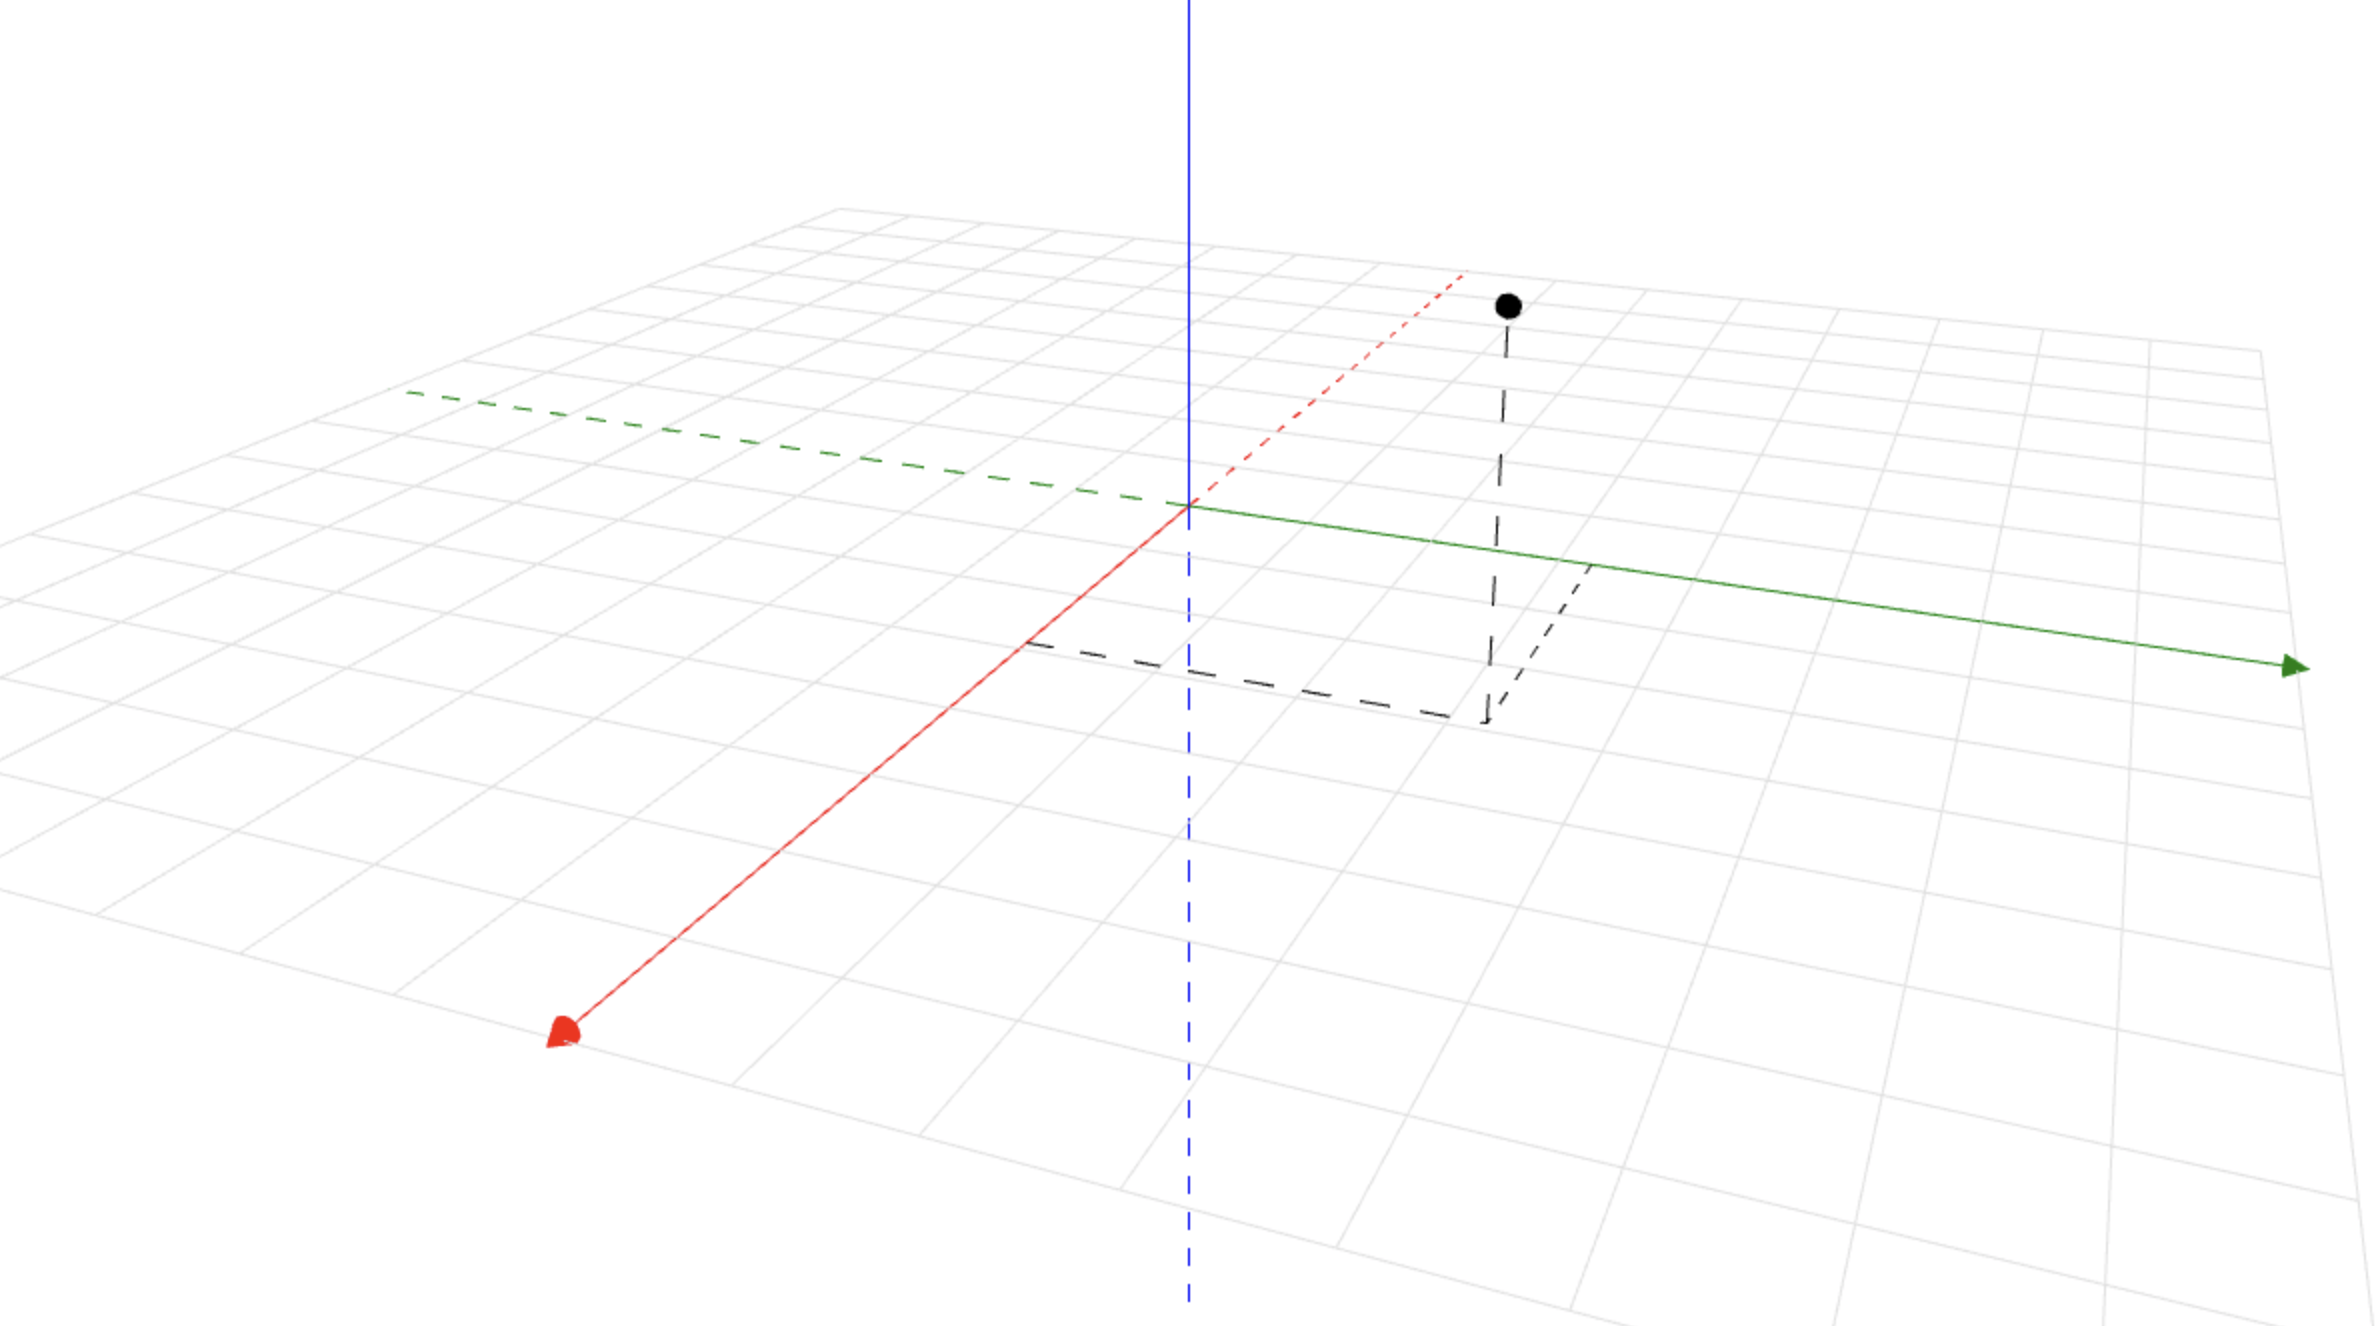
Points in Space
Demonstrates plotting a point in 3D.
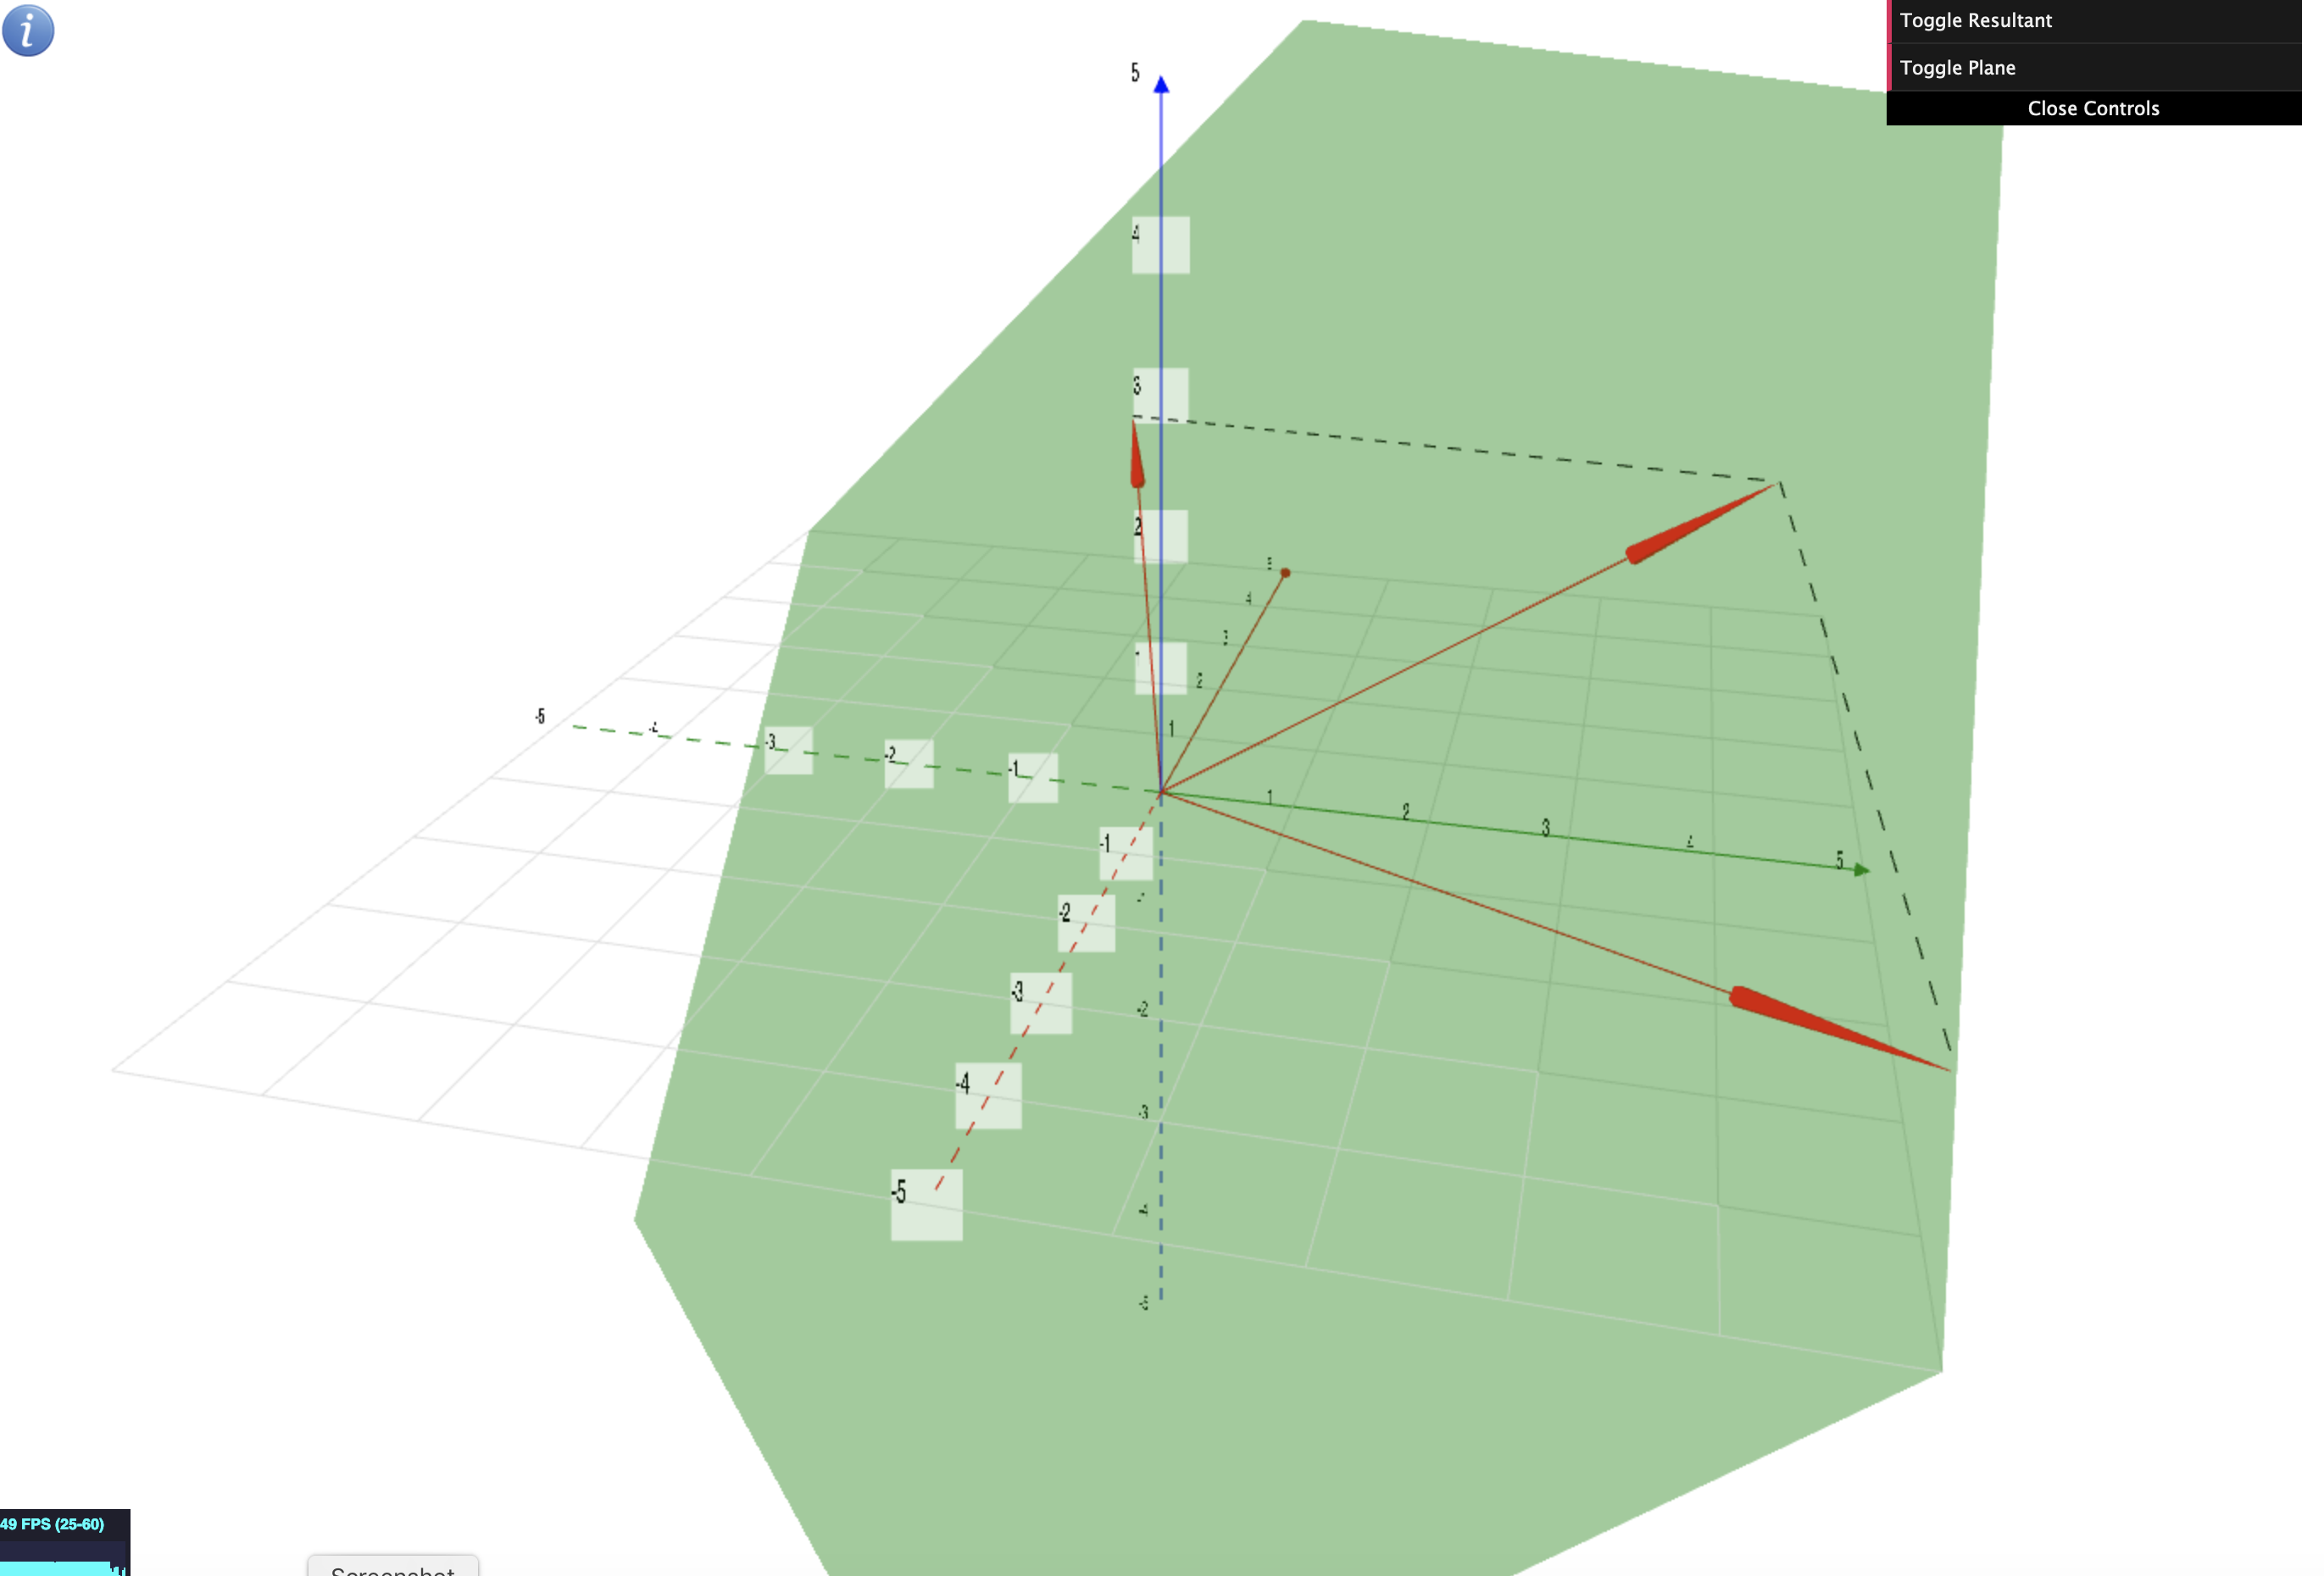
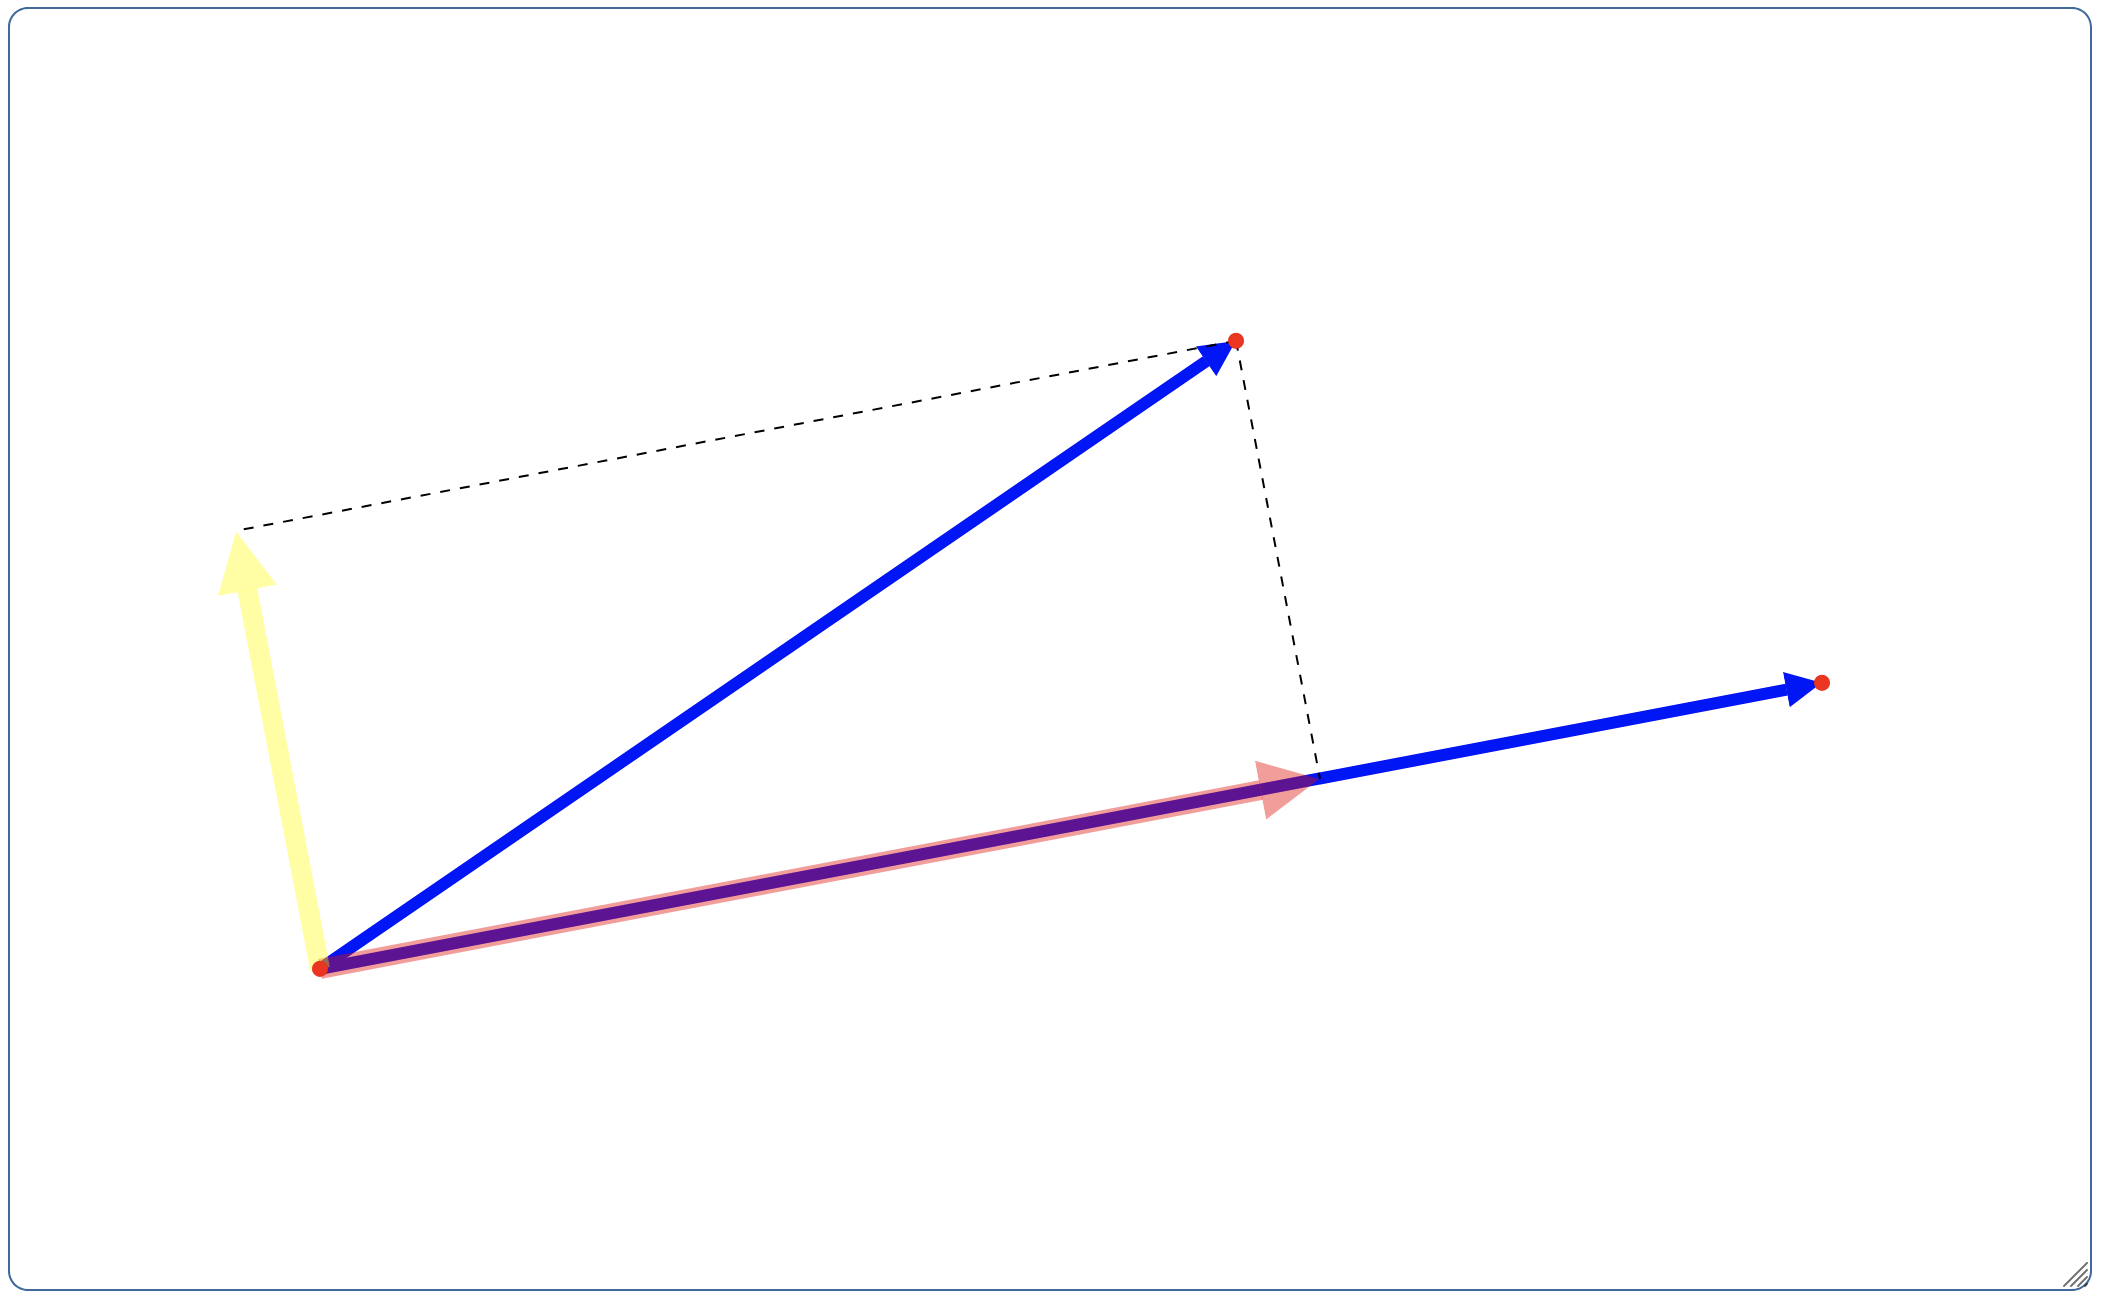
3D Vector Sum
Illustrates the geometric relationship of the sum of two vectors in 3D.
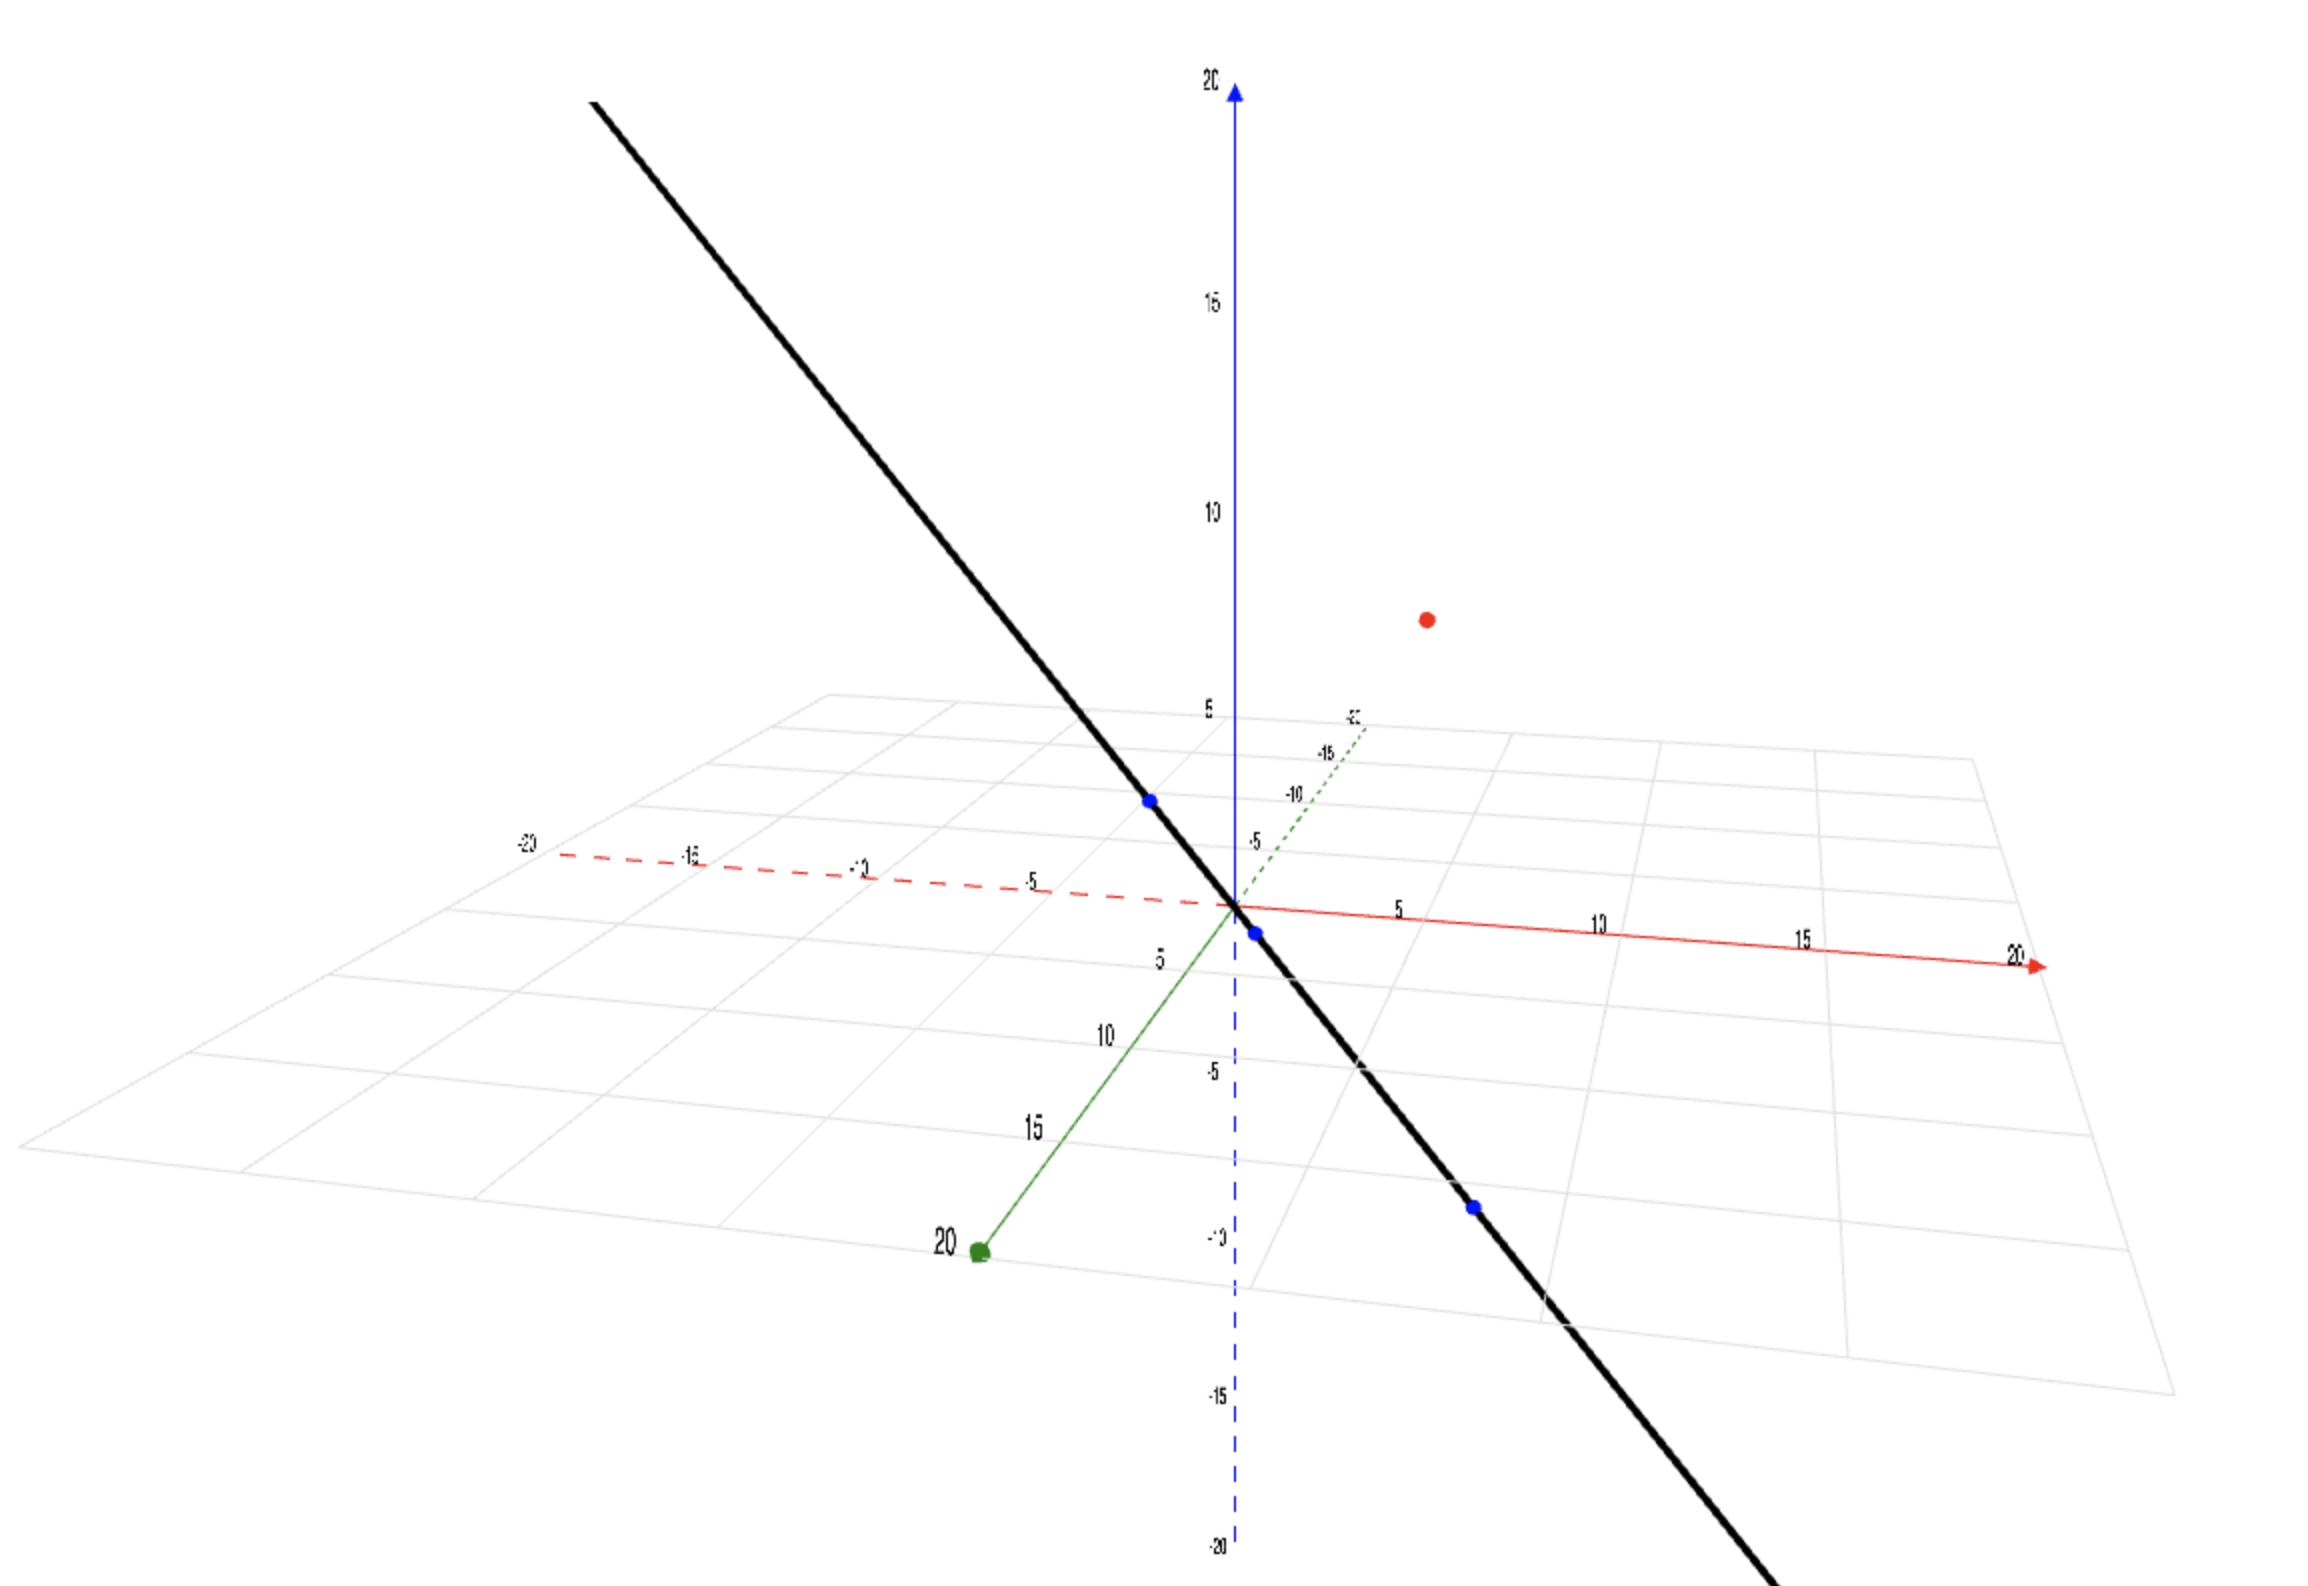
Collinear Points
Illustrates the concept of how three points can lie on a line in 3D.
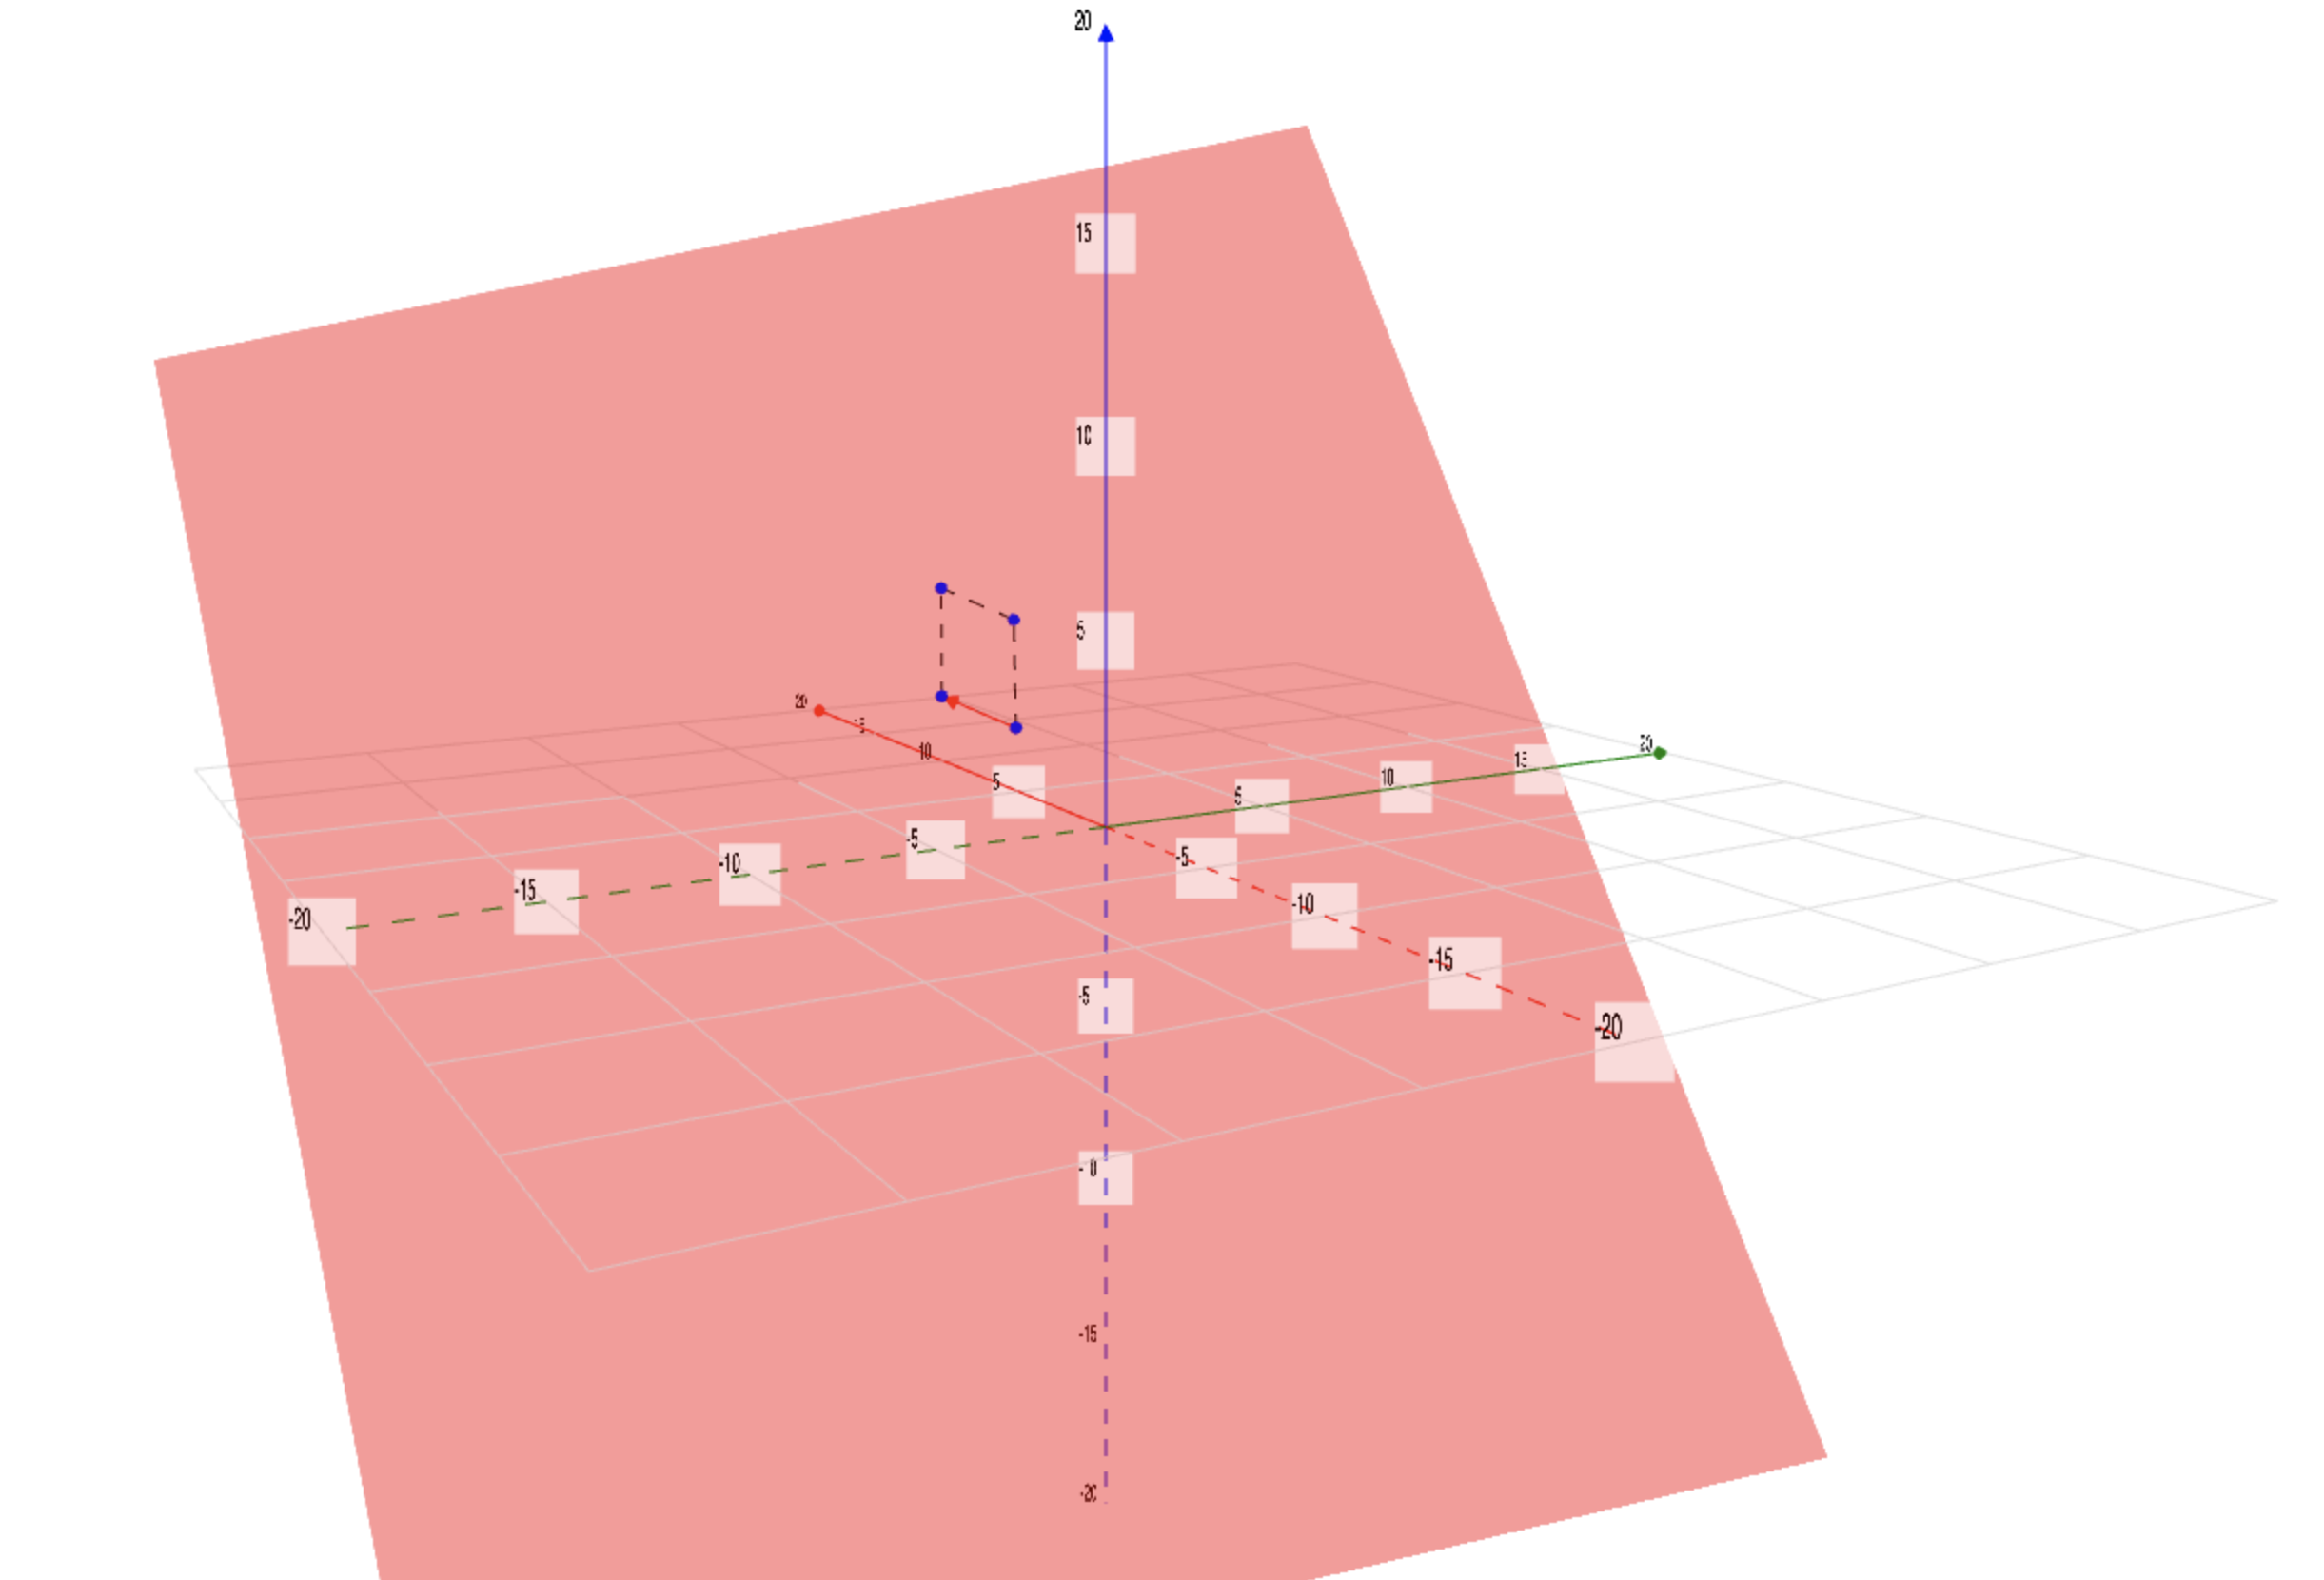
Parallelogram Points
Demonstrates how to show that 4 points in space form a parallelogram.
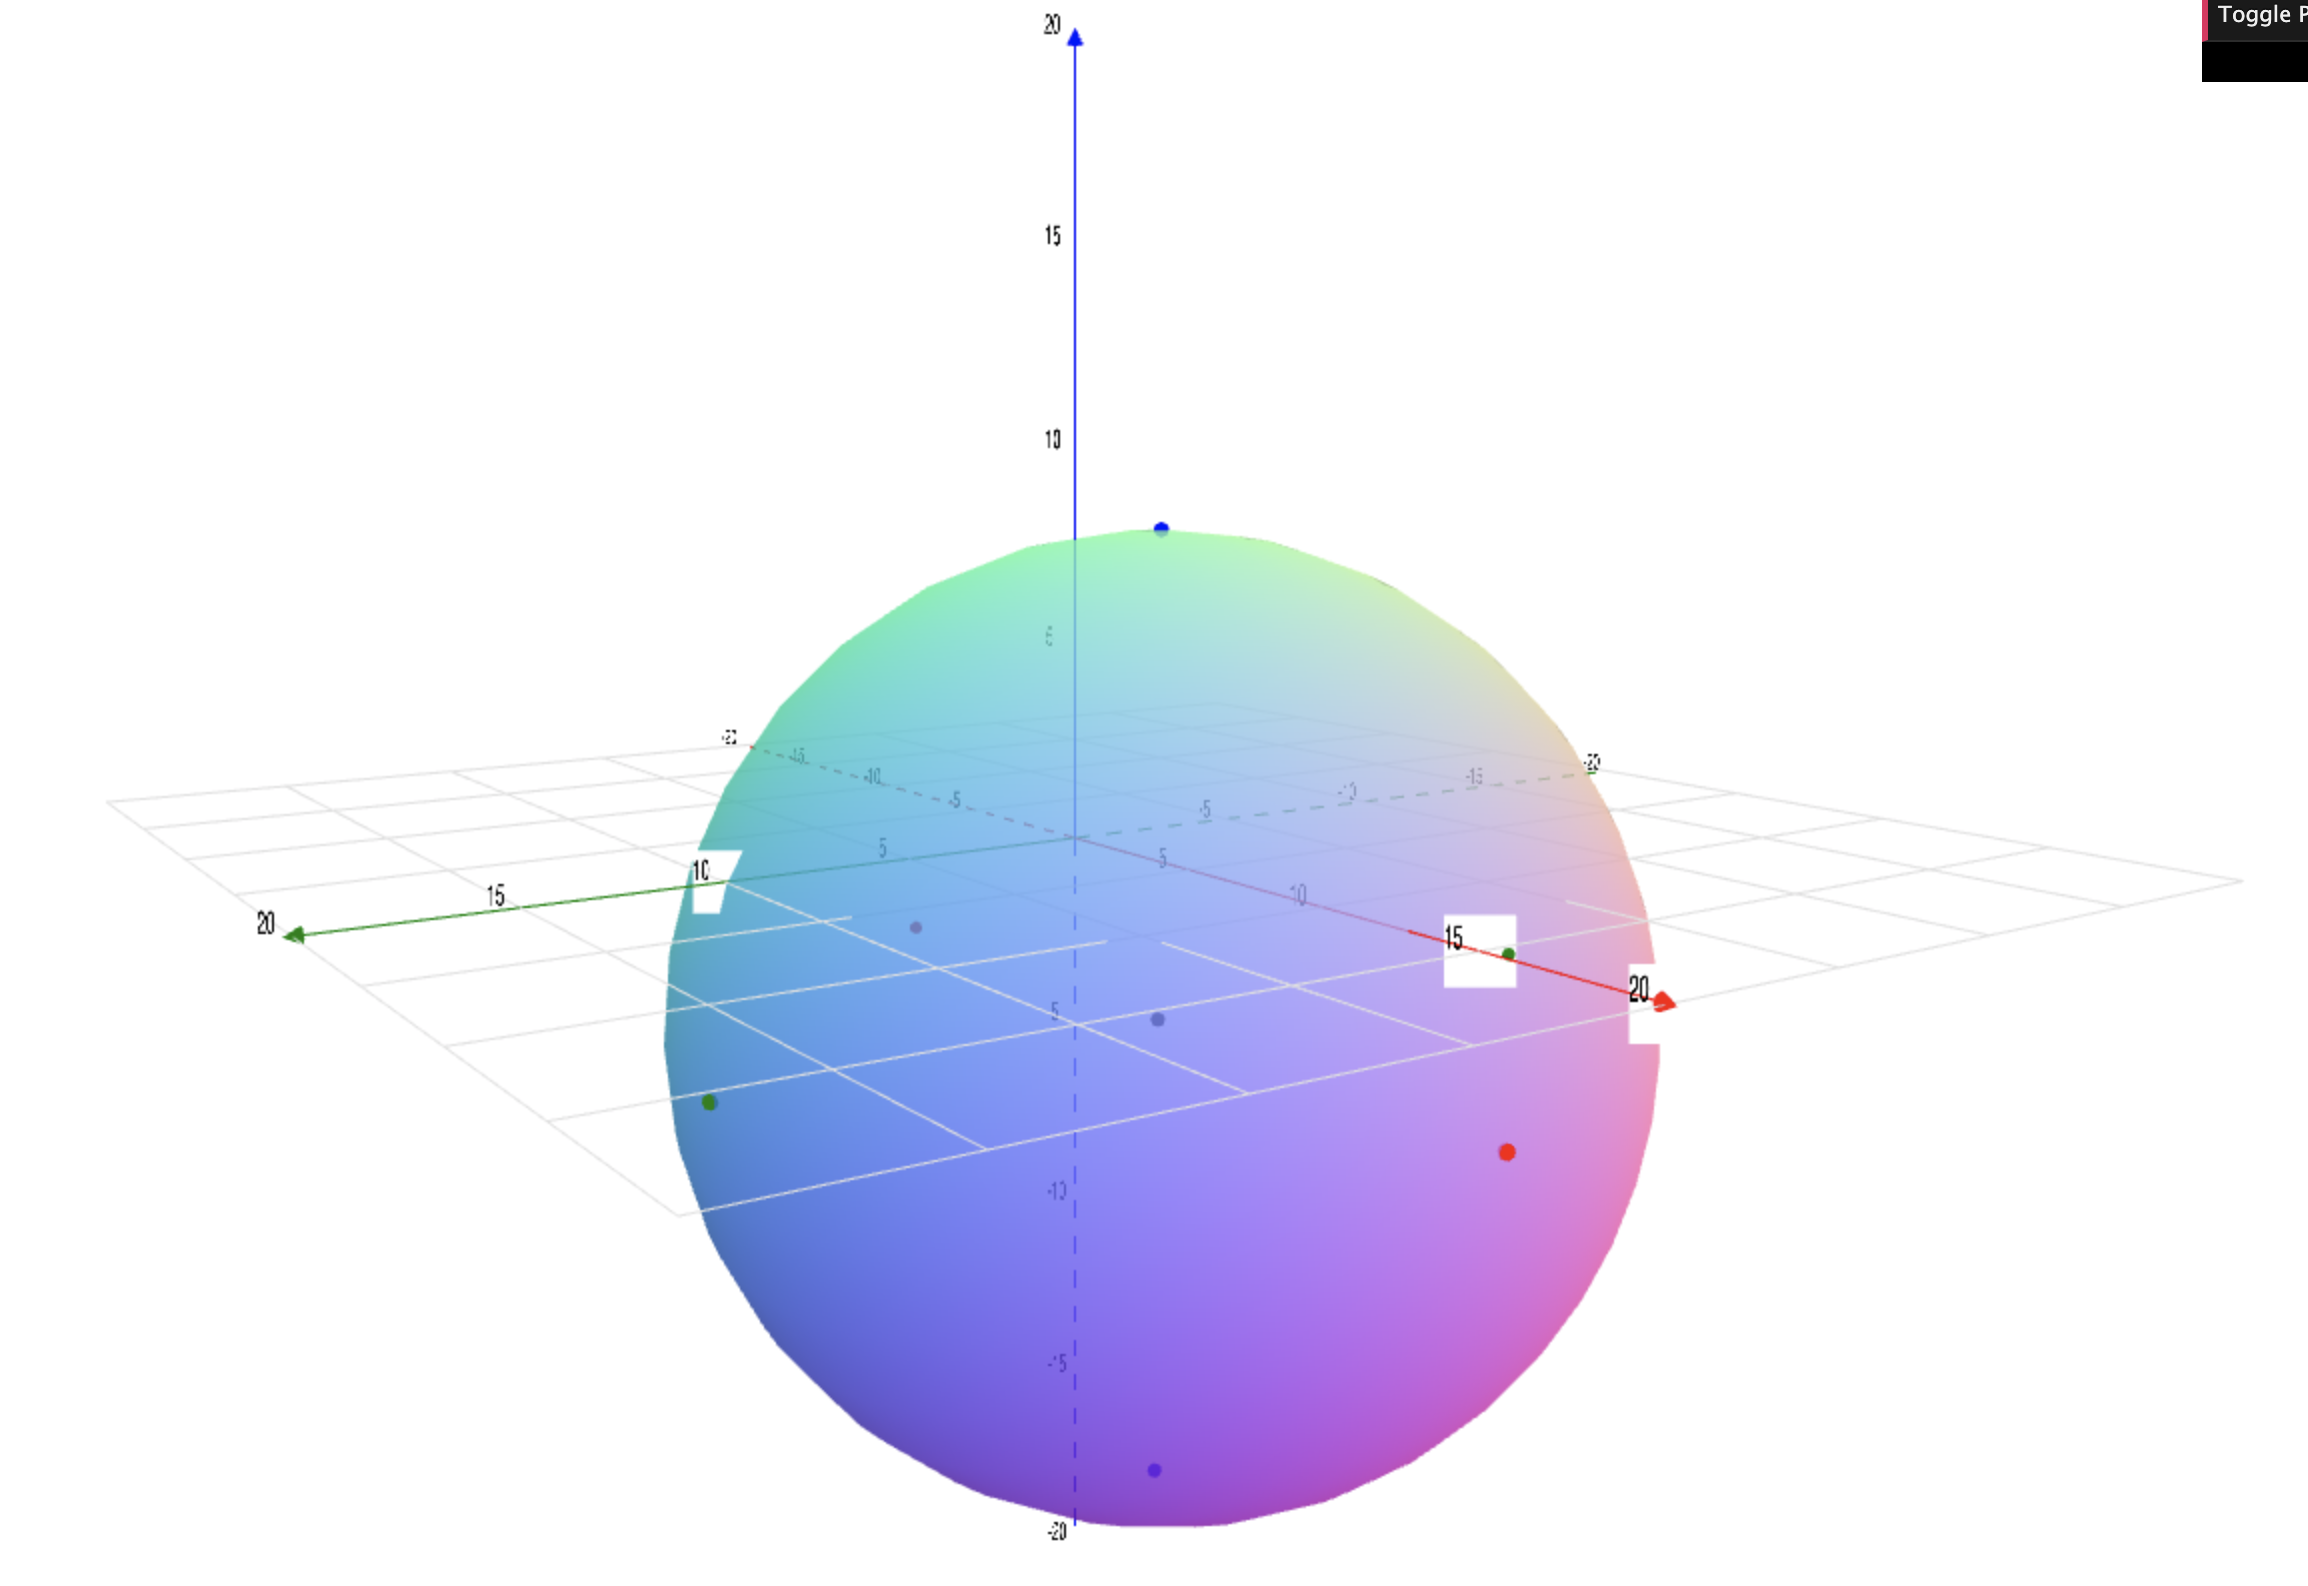
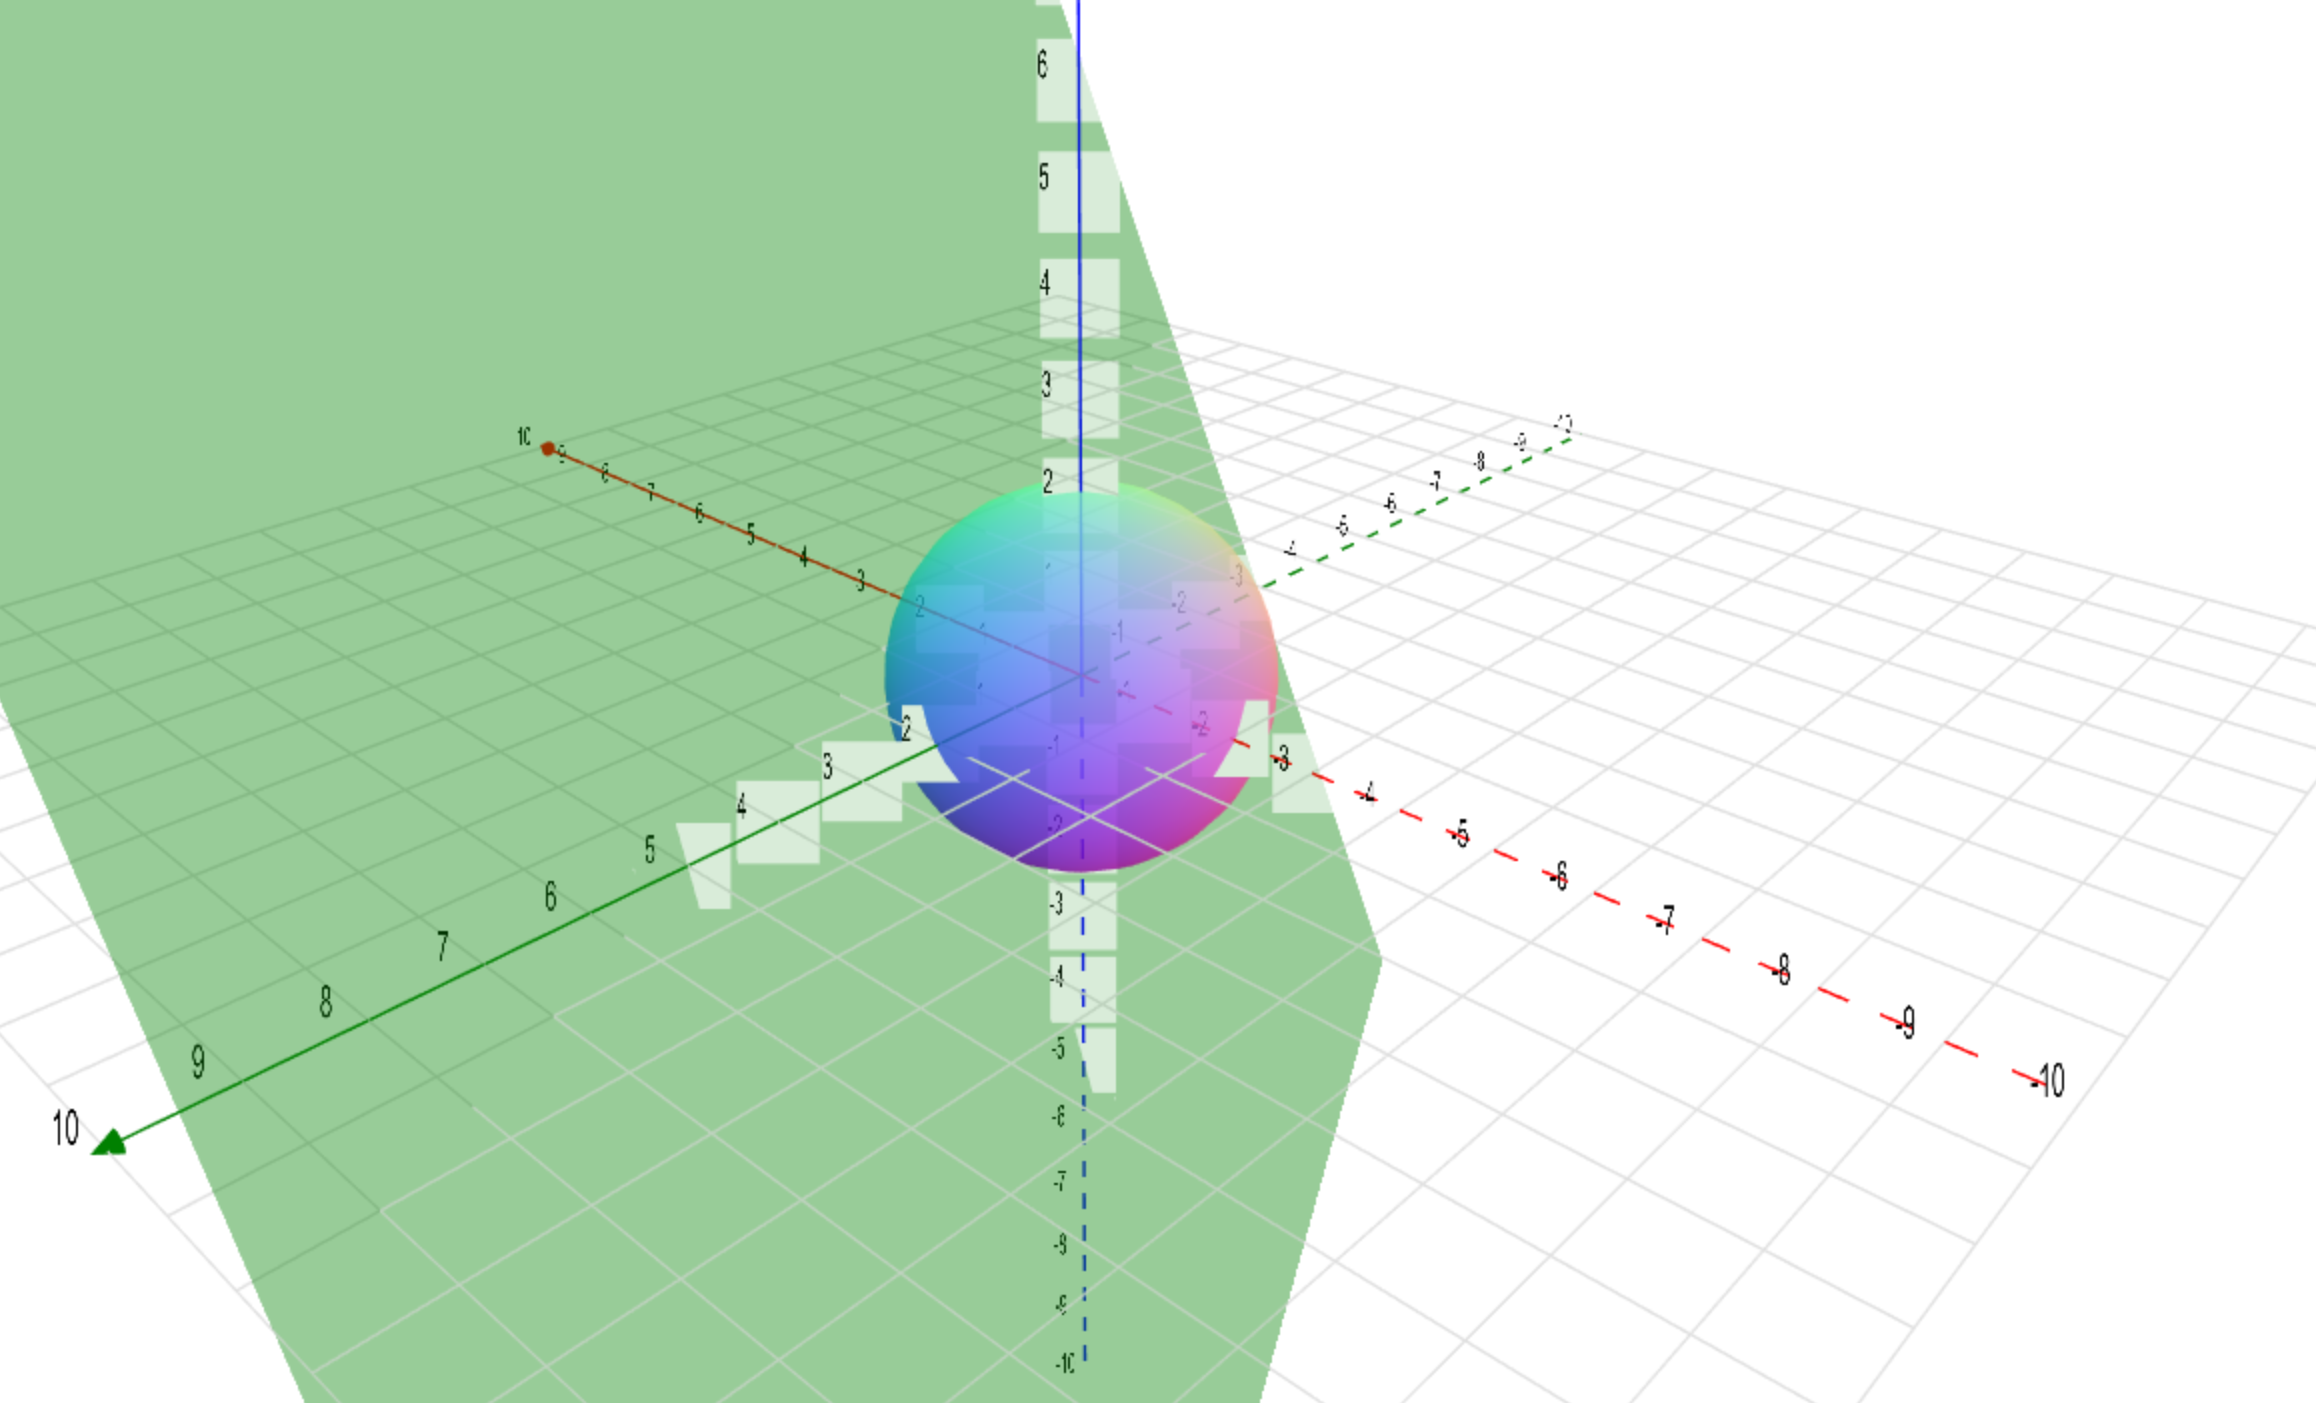
Sphere
Allows the user to draw spheres in different center points and radii.
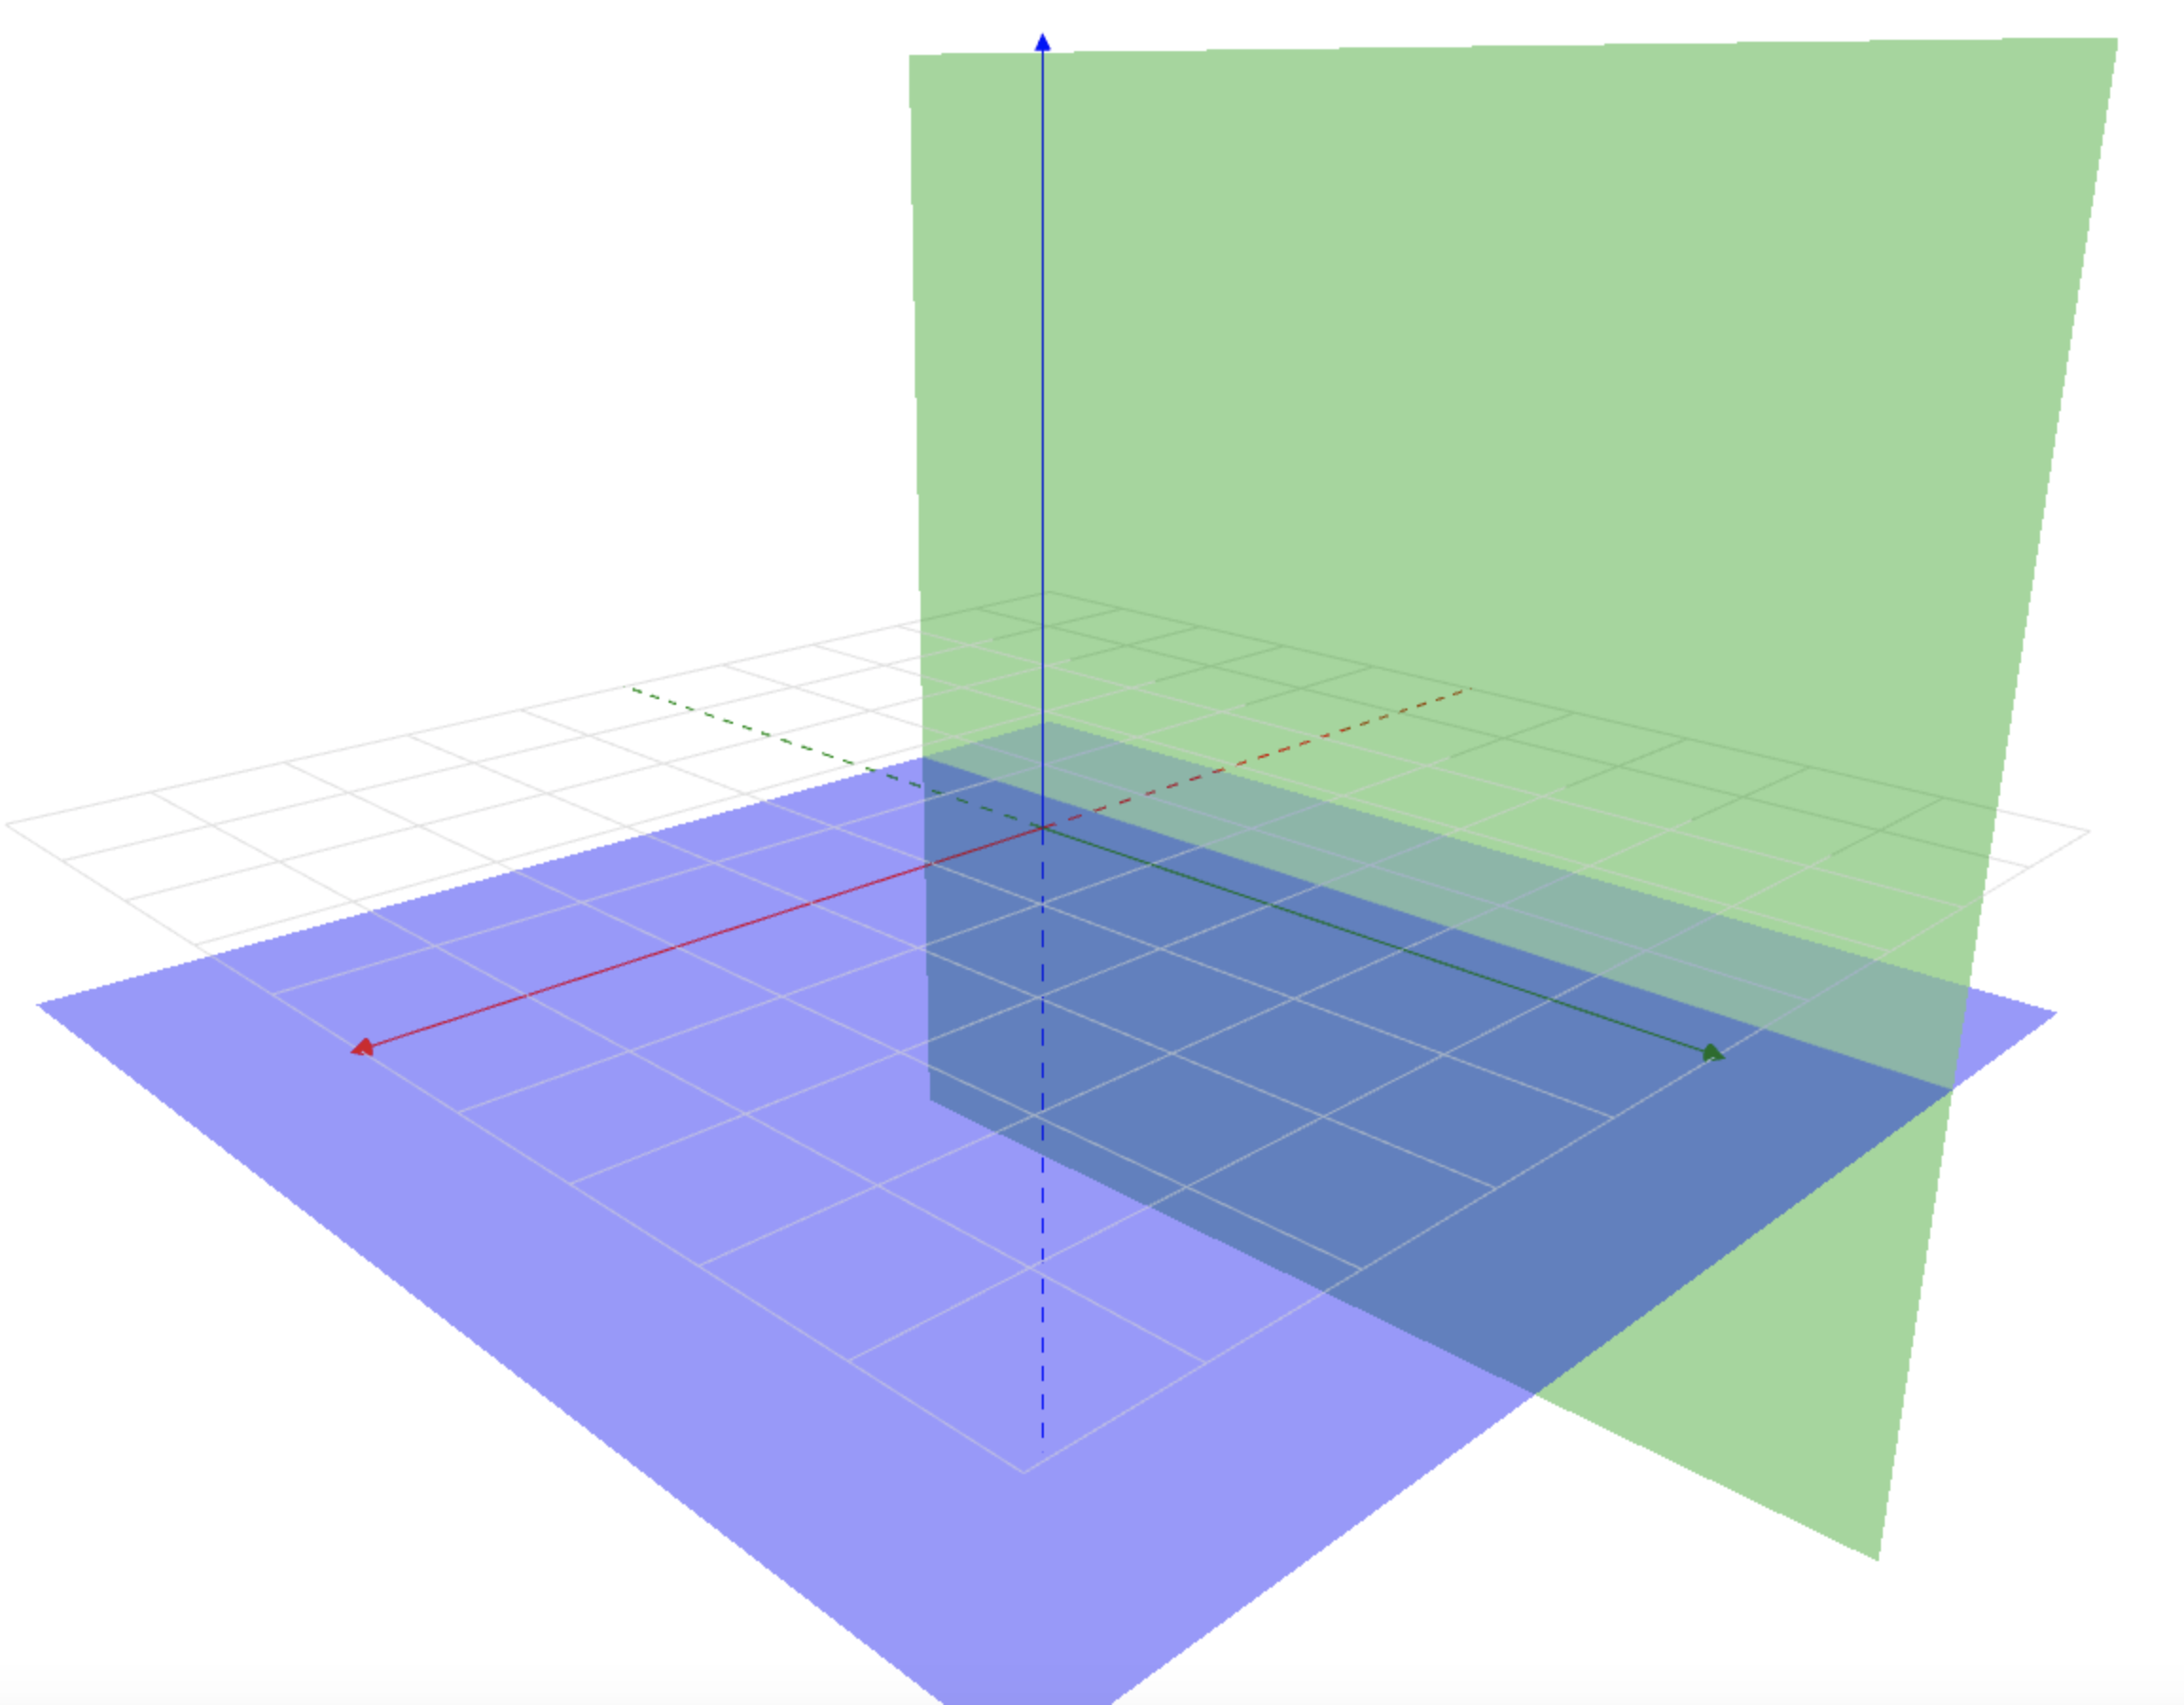
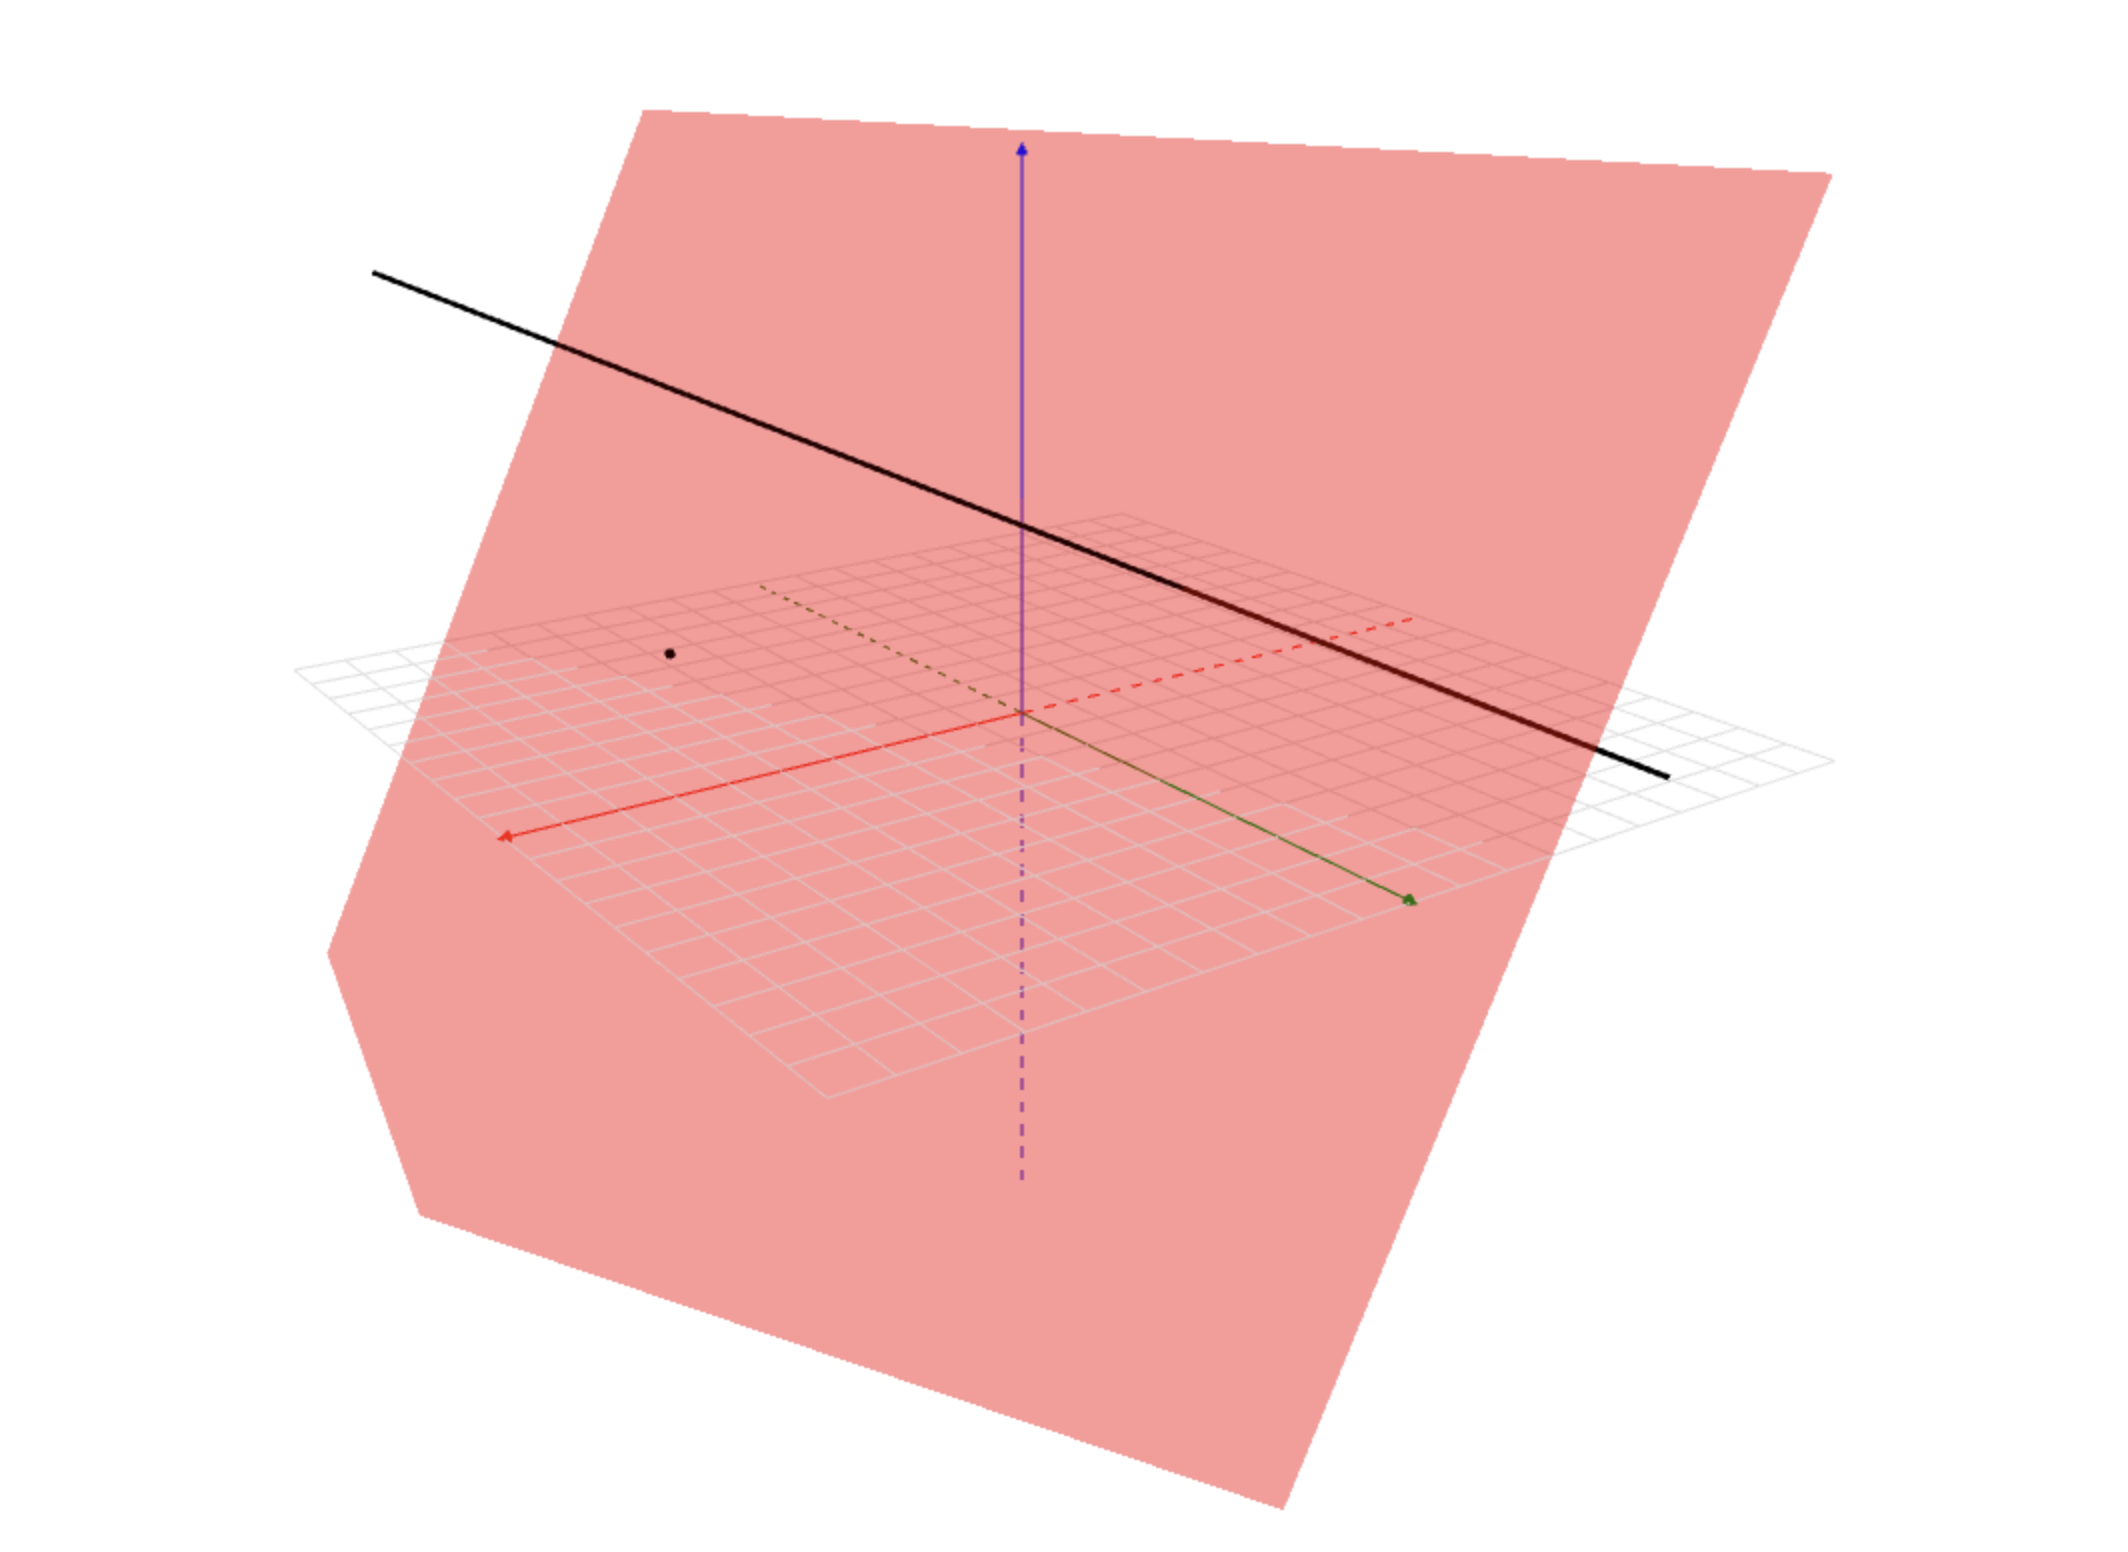
Horizontal and Vertical Planes
Demonstrates some basic horizontal and vertical planes in 3D.
Vector Projections
Demonstrates what a vector projection and an orthogonal vector projection look like.
Dot Products
Allows user to visually see the result of the dot product.
Intersecting and Skew Lines
Demonstrates the difference between lines that intersect in space and lines that are skew.
Intercepts of Planes
Demonstrates what the intercepts of a plane looks like in space.
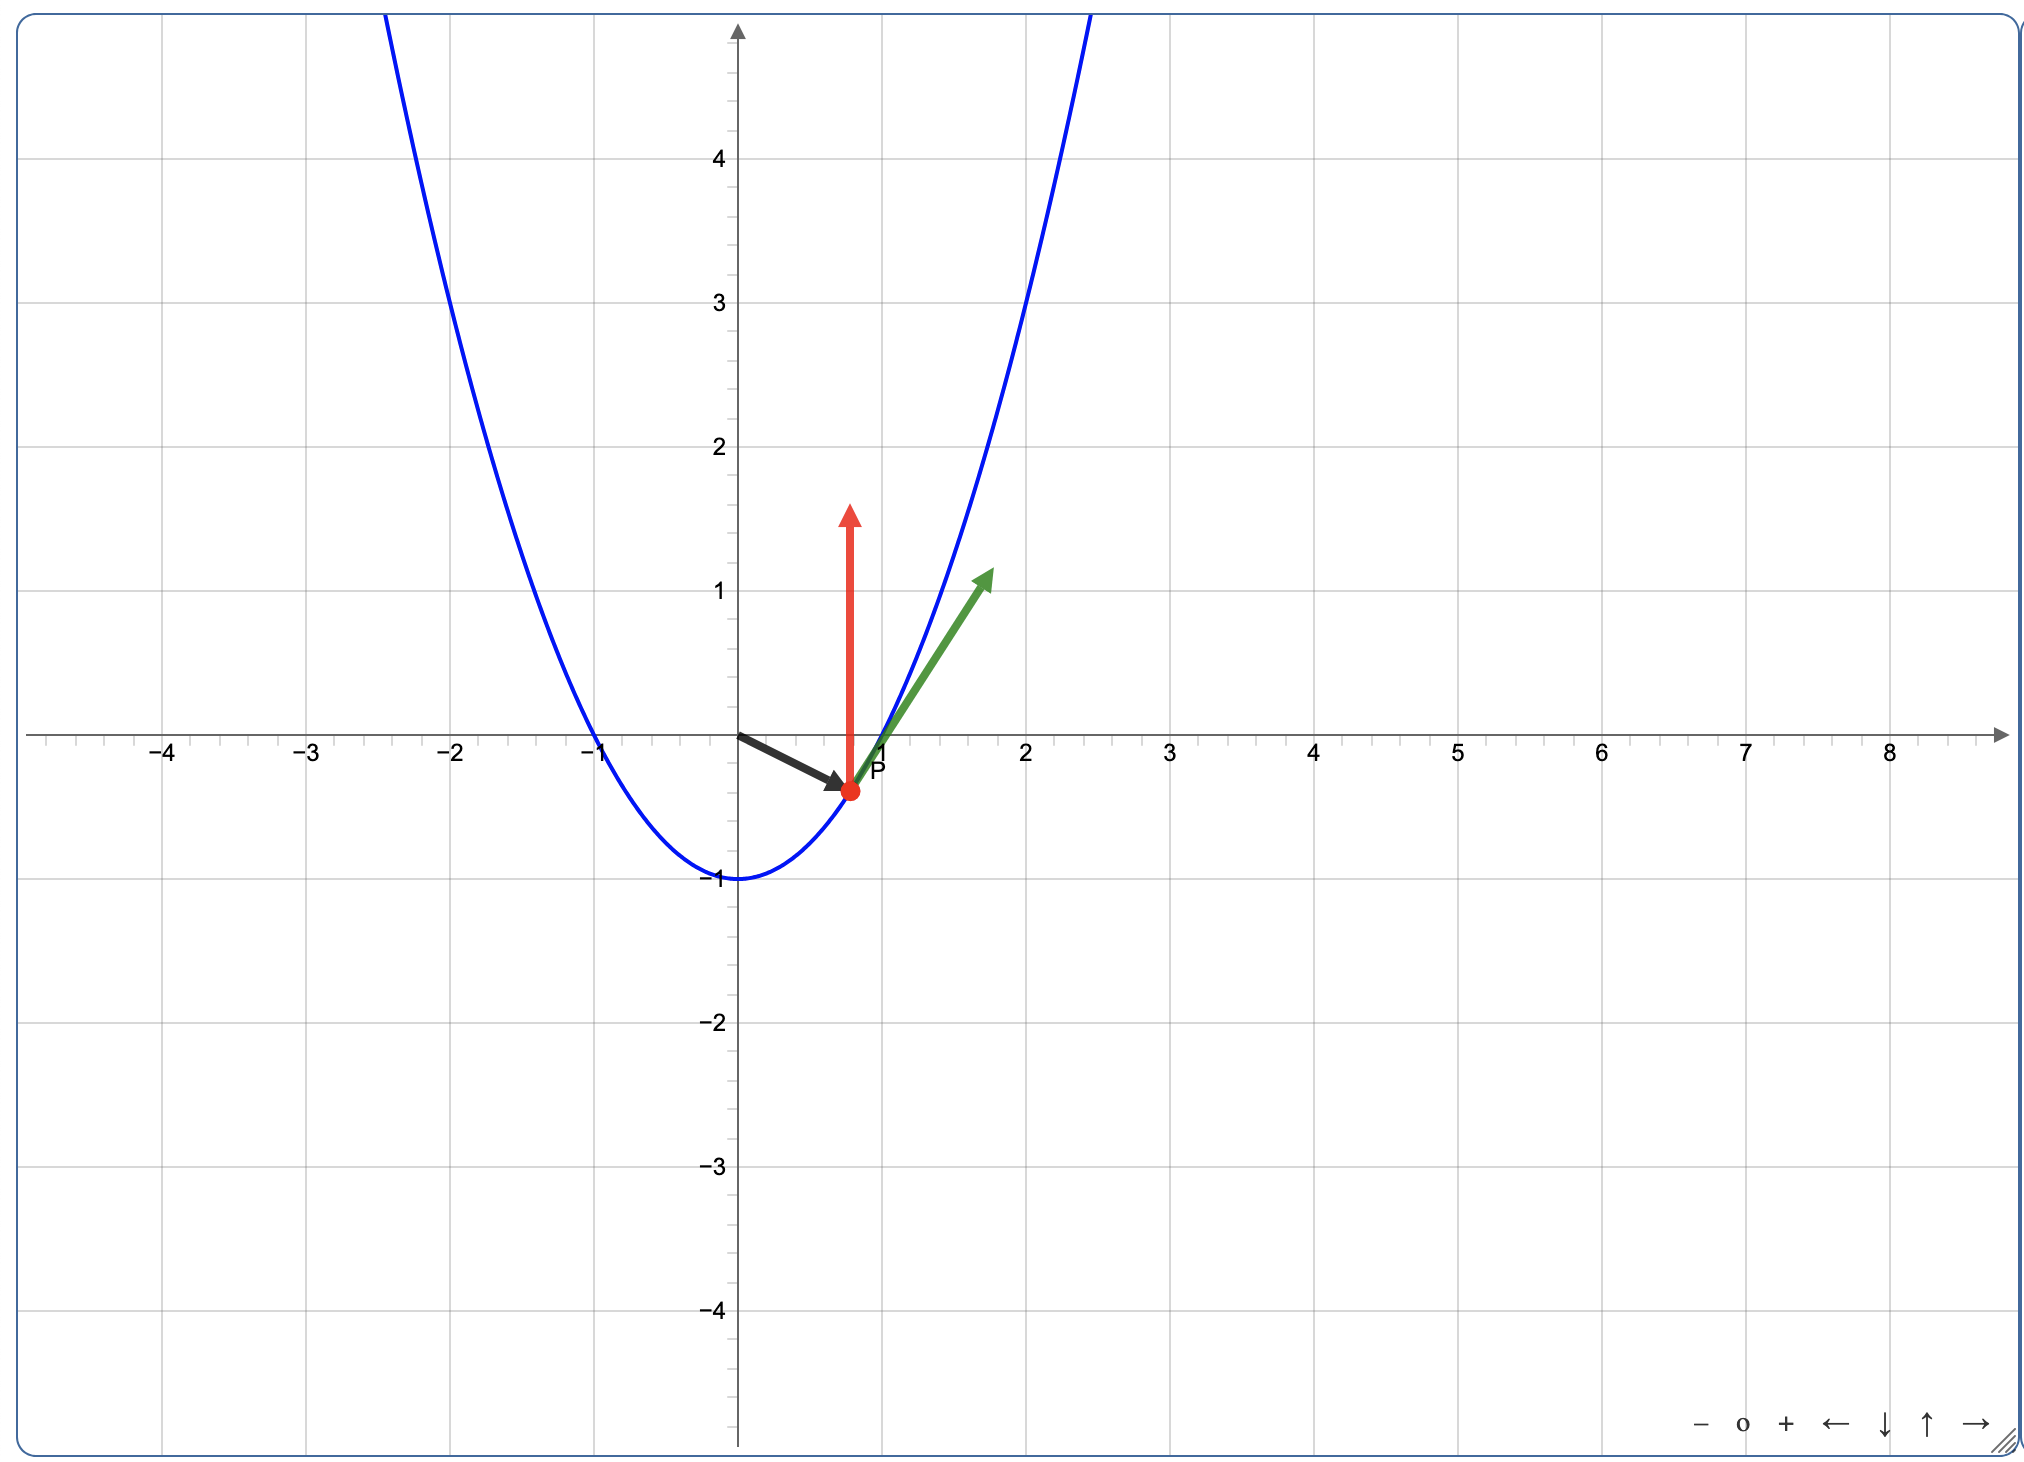
Graphing Vector-Valued Functions in the Plane
Demonstrates how vector-valued functions are graphed in the plane. The applet can also show the relationship between
the function and it's first and second derivative vectors.
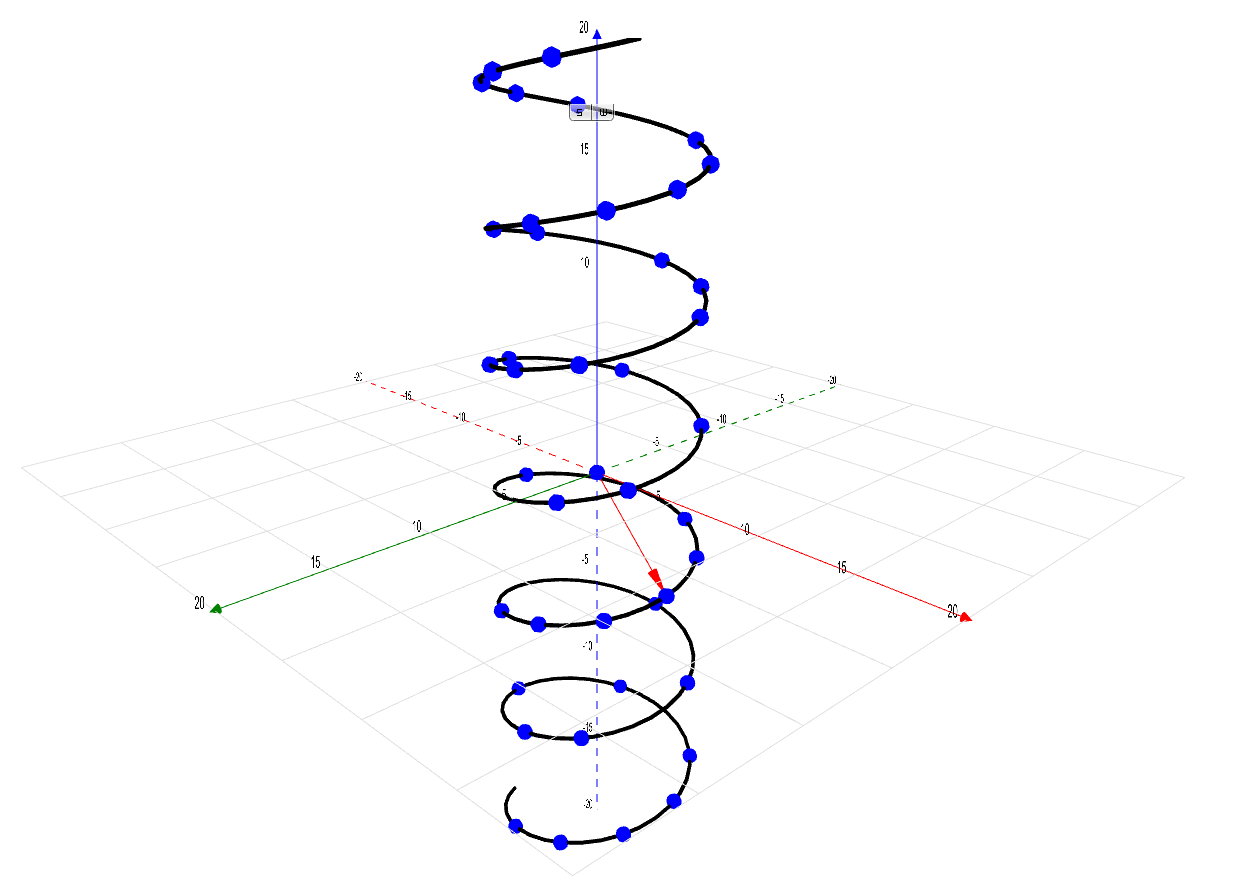
Graphing Vector-Valued Functions
Demonstrates how vector-valued functions are graphed in space.
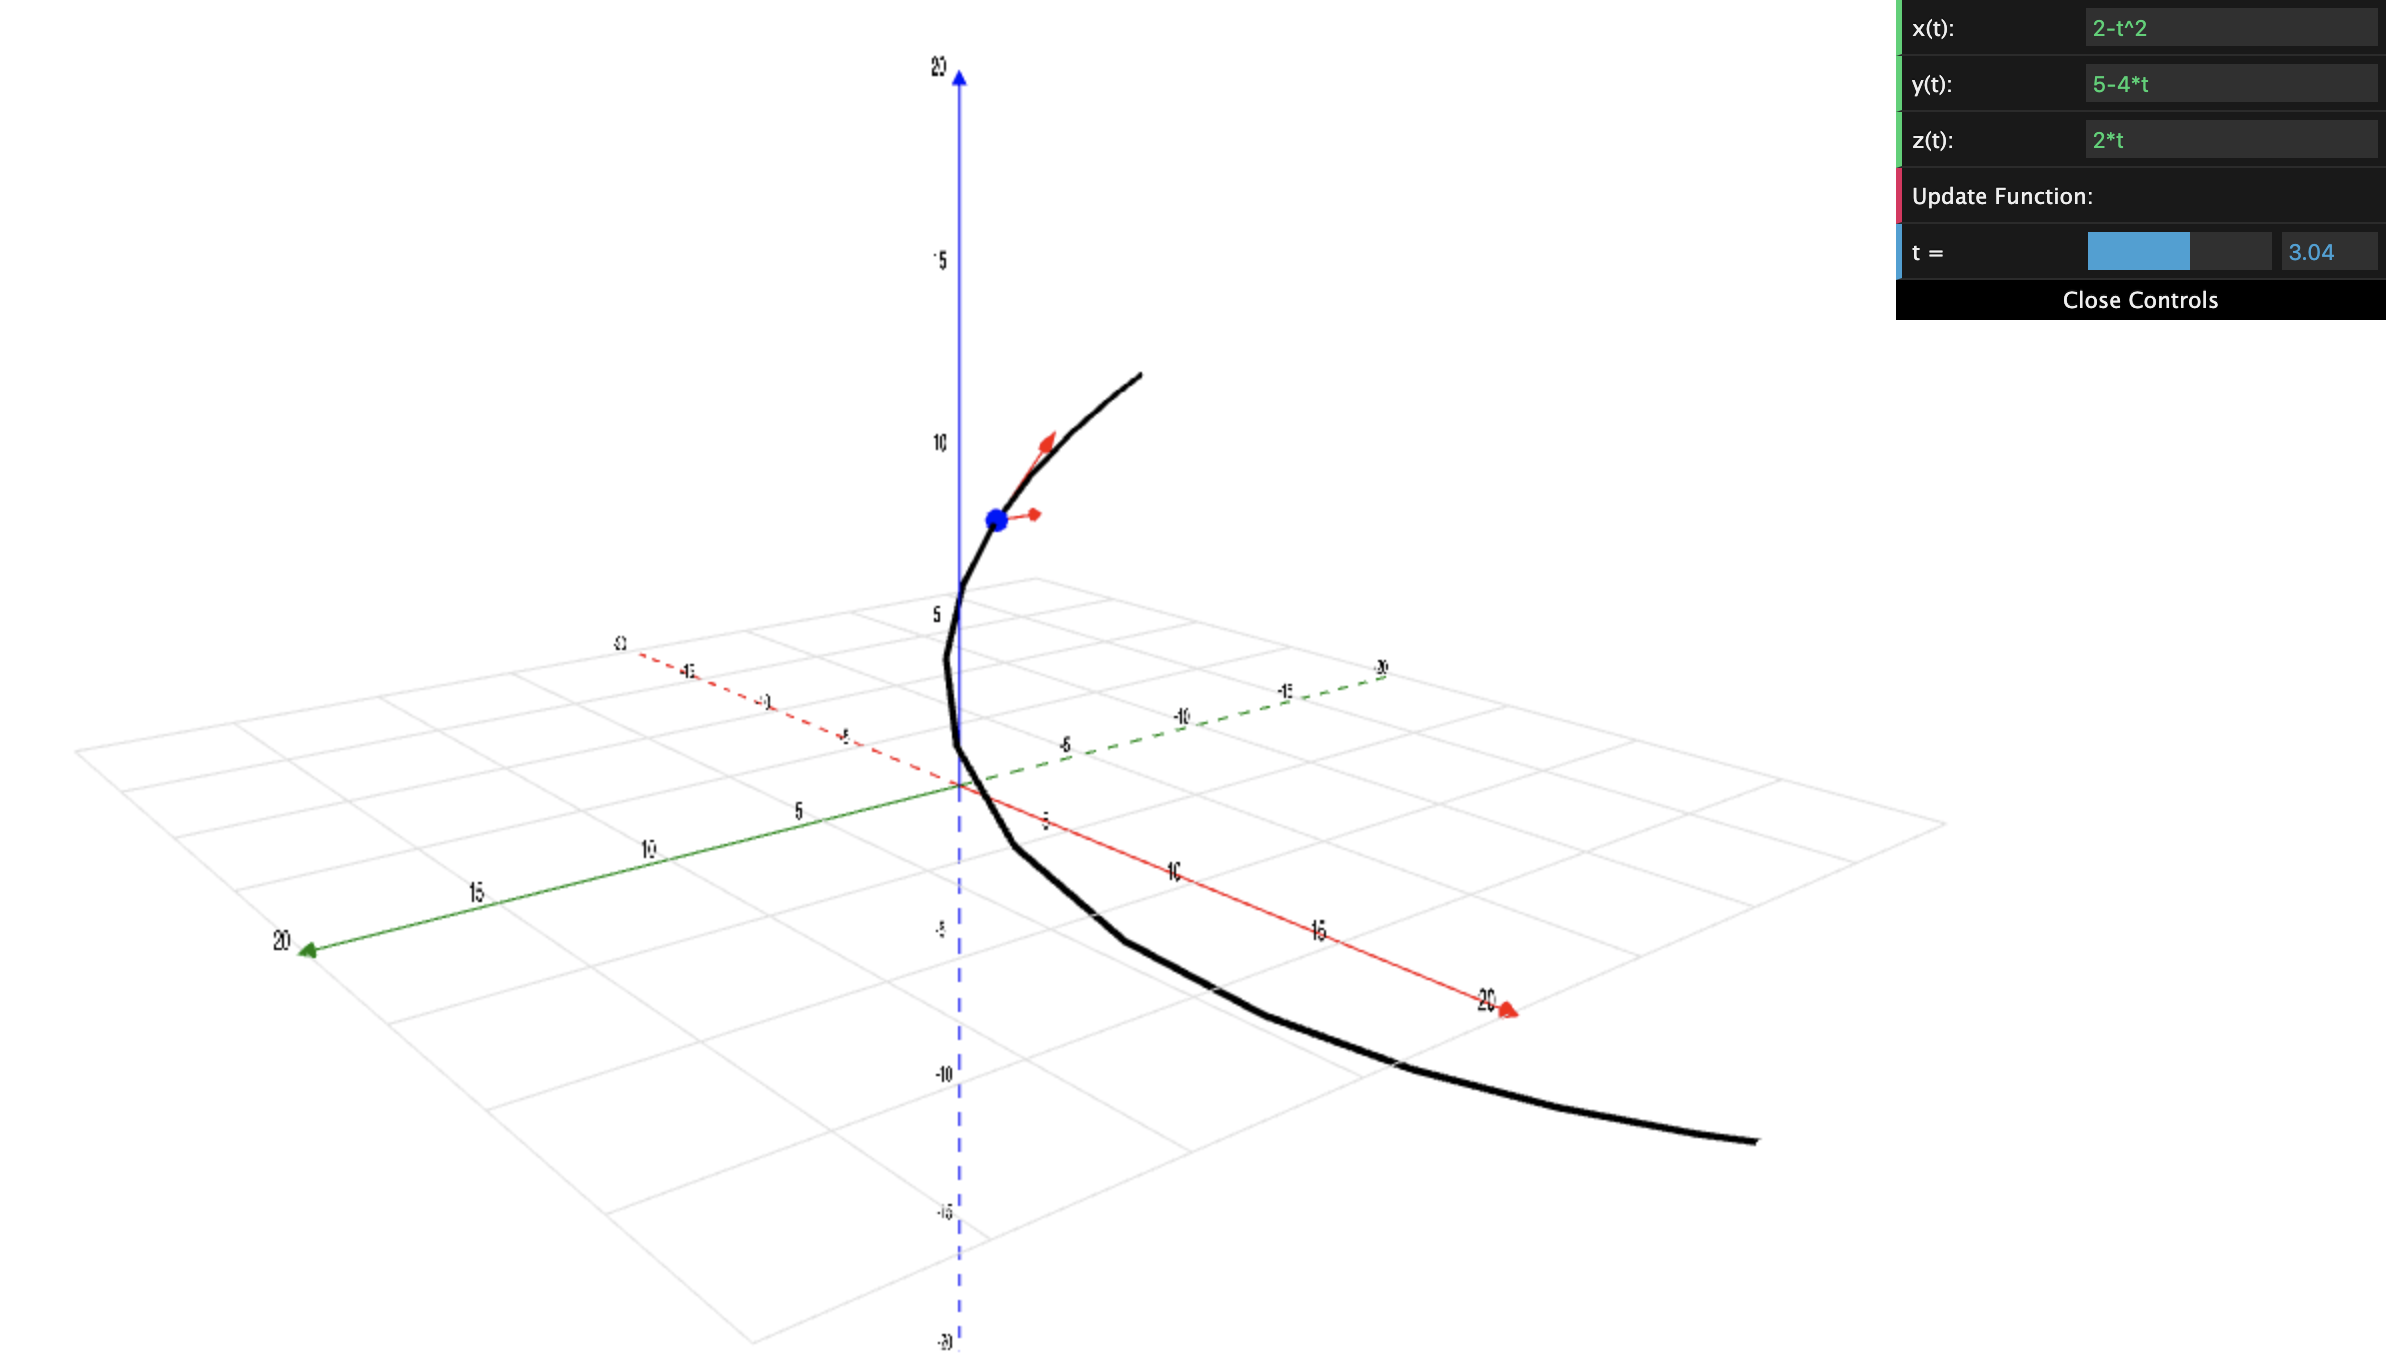
Velocity and Acceleration
Demonstrates the relationship between the velocity and acceleration vectors with respect to a point on a 3D vector-valued function.
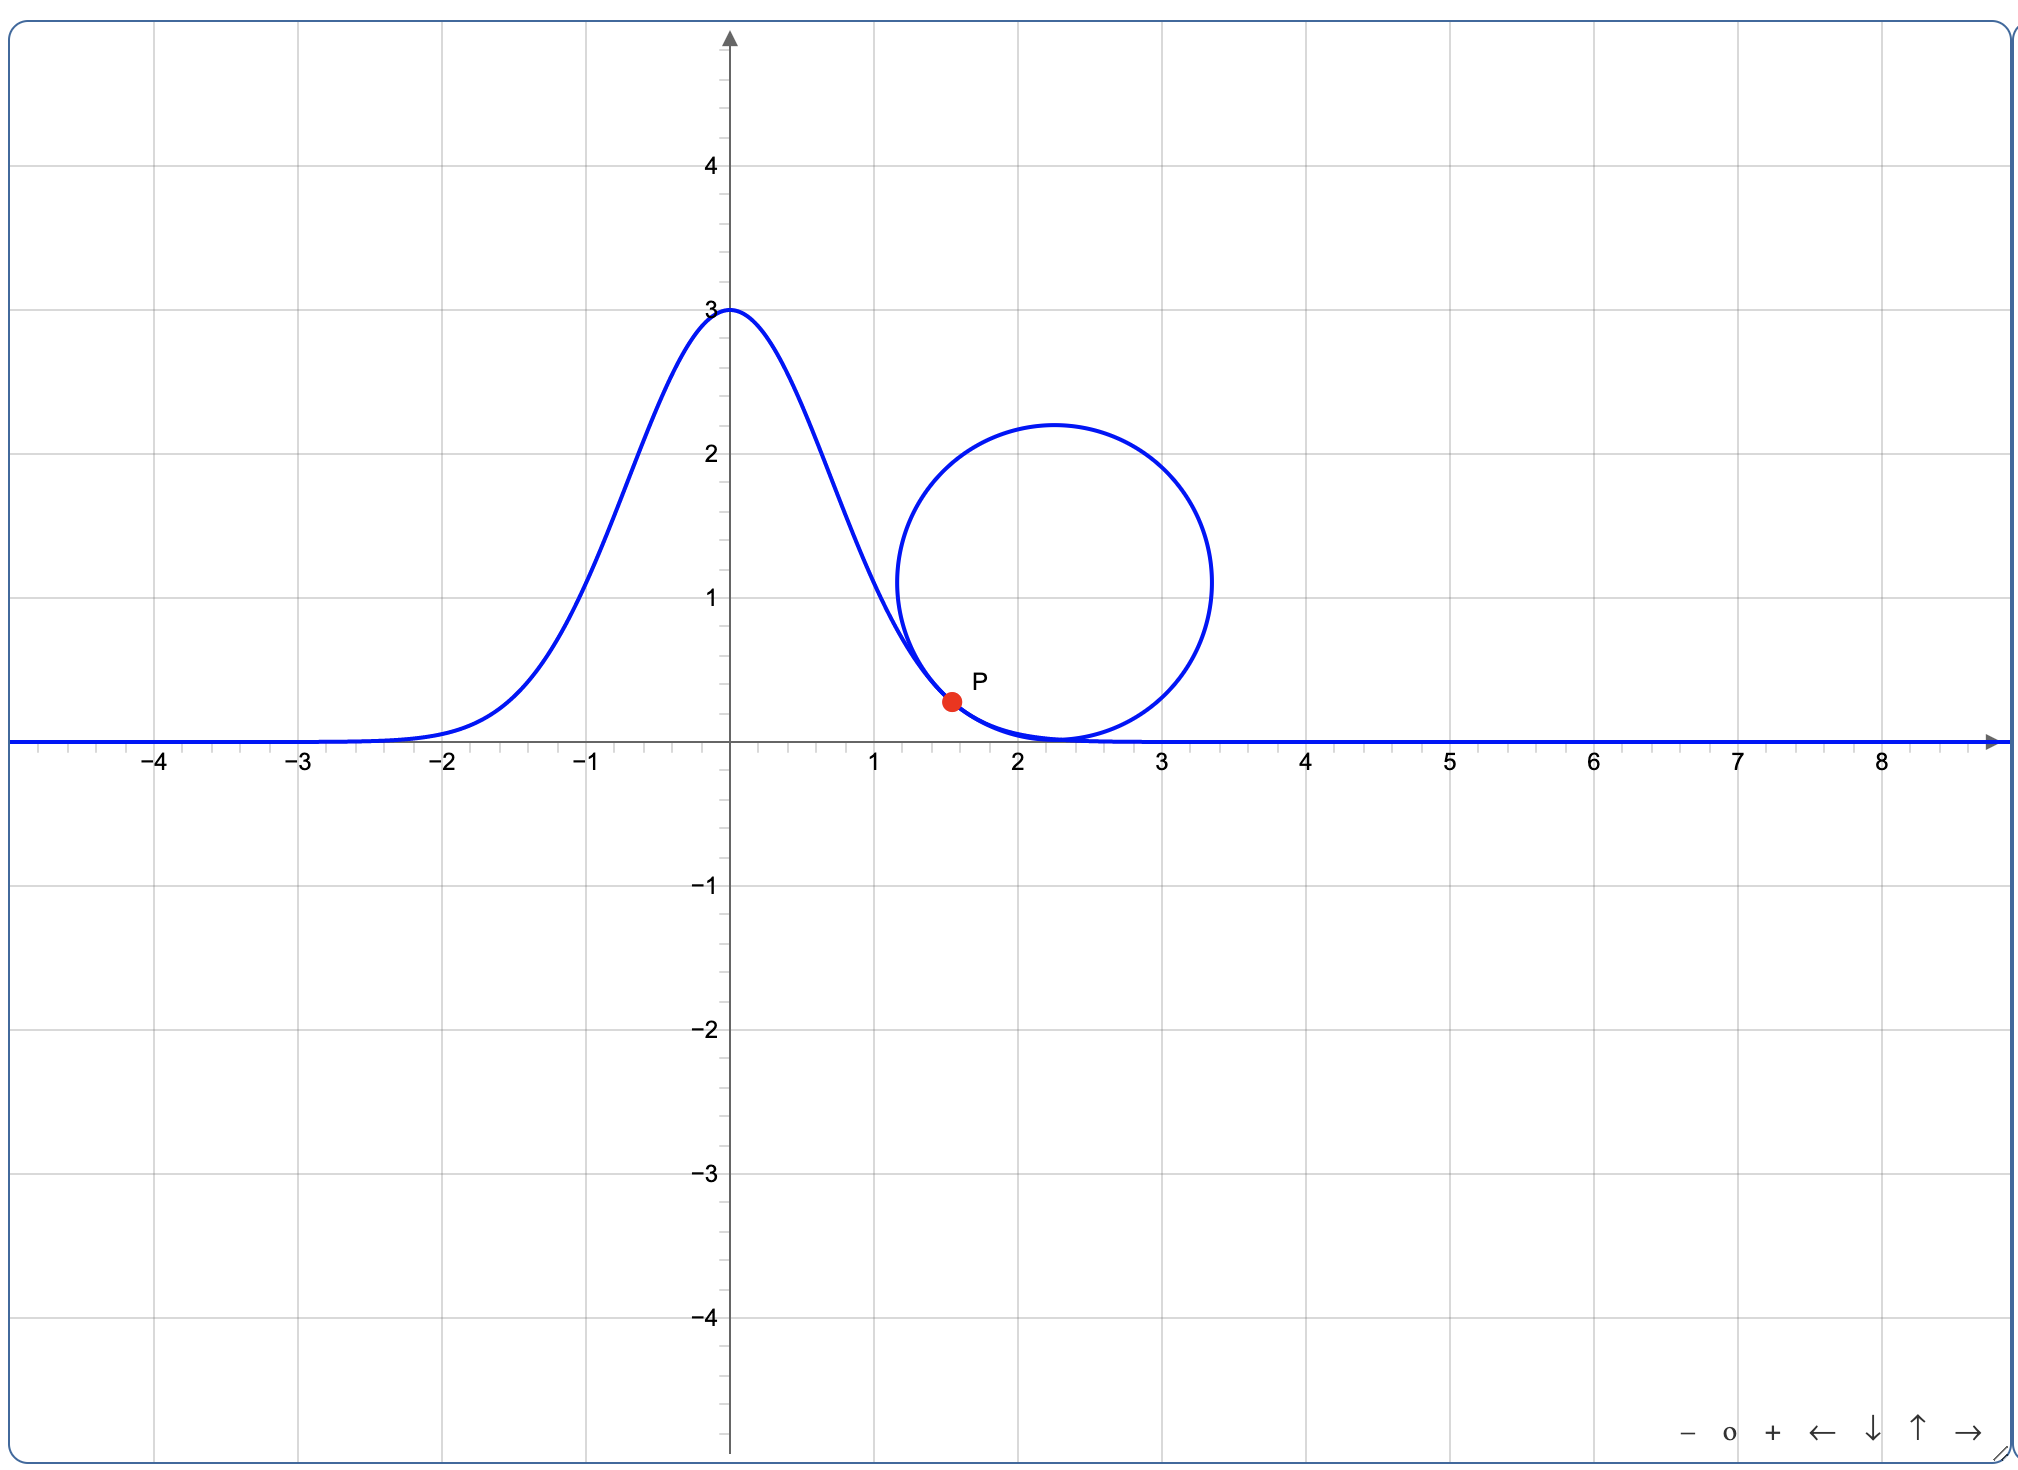
Curvature
Demonstrates how curvature works on a 2D curve.
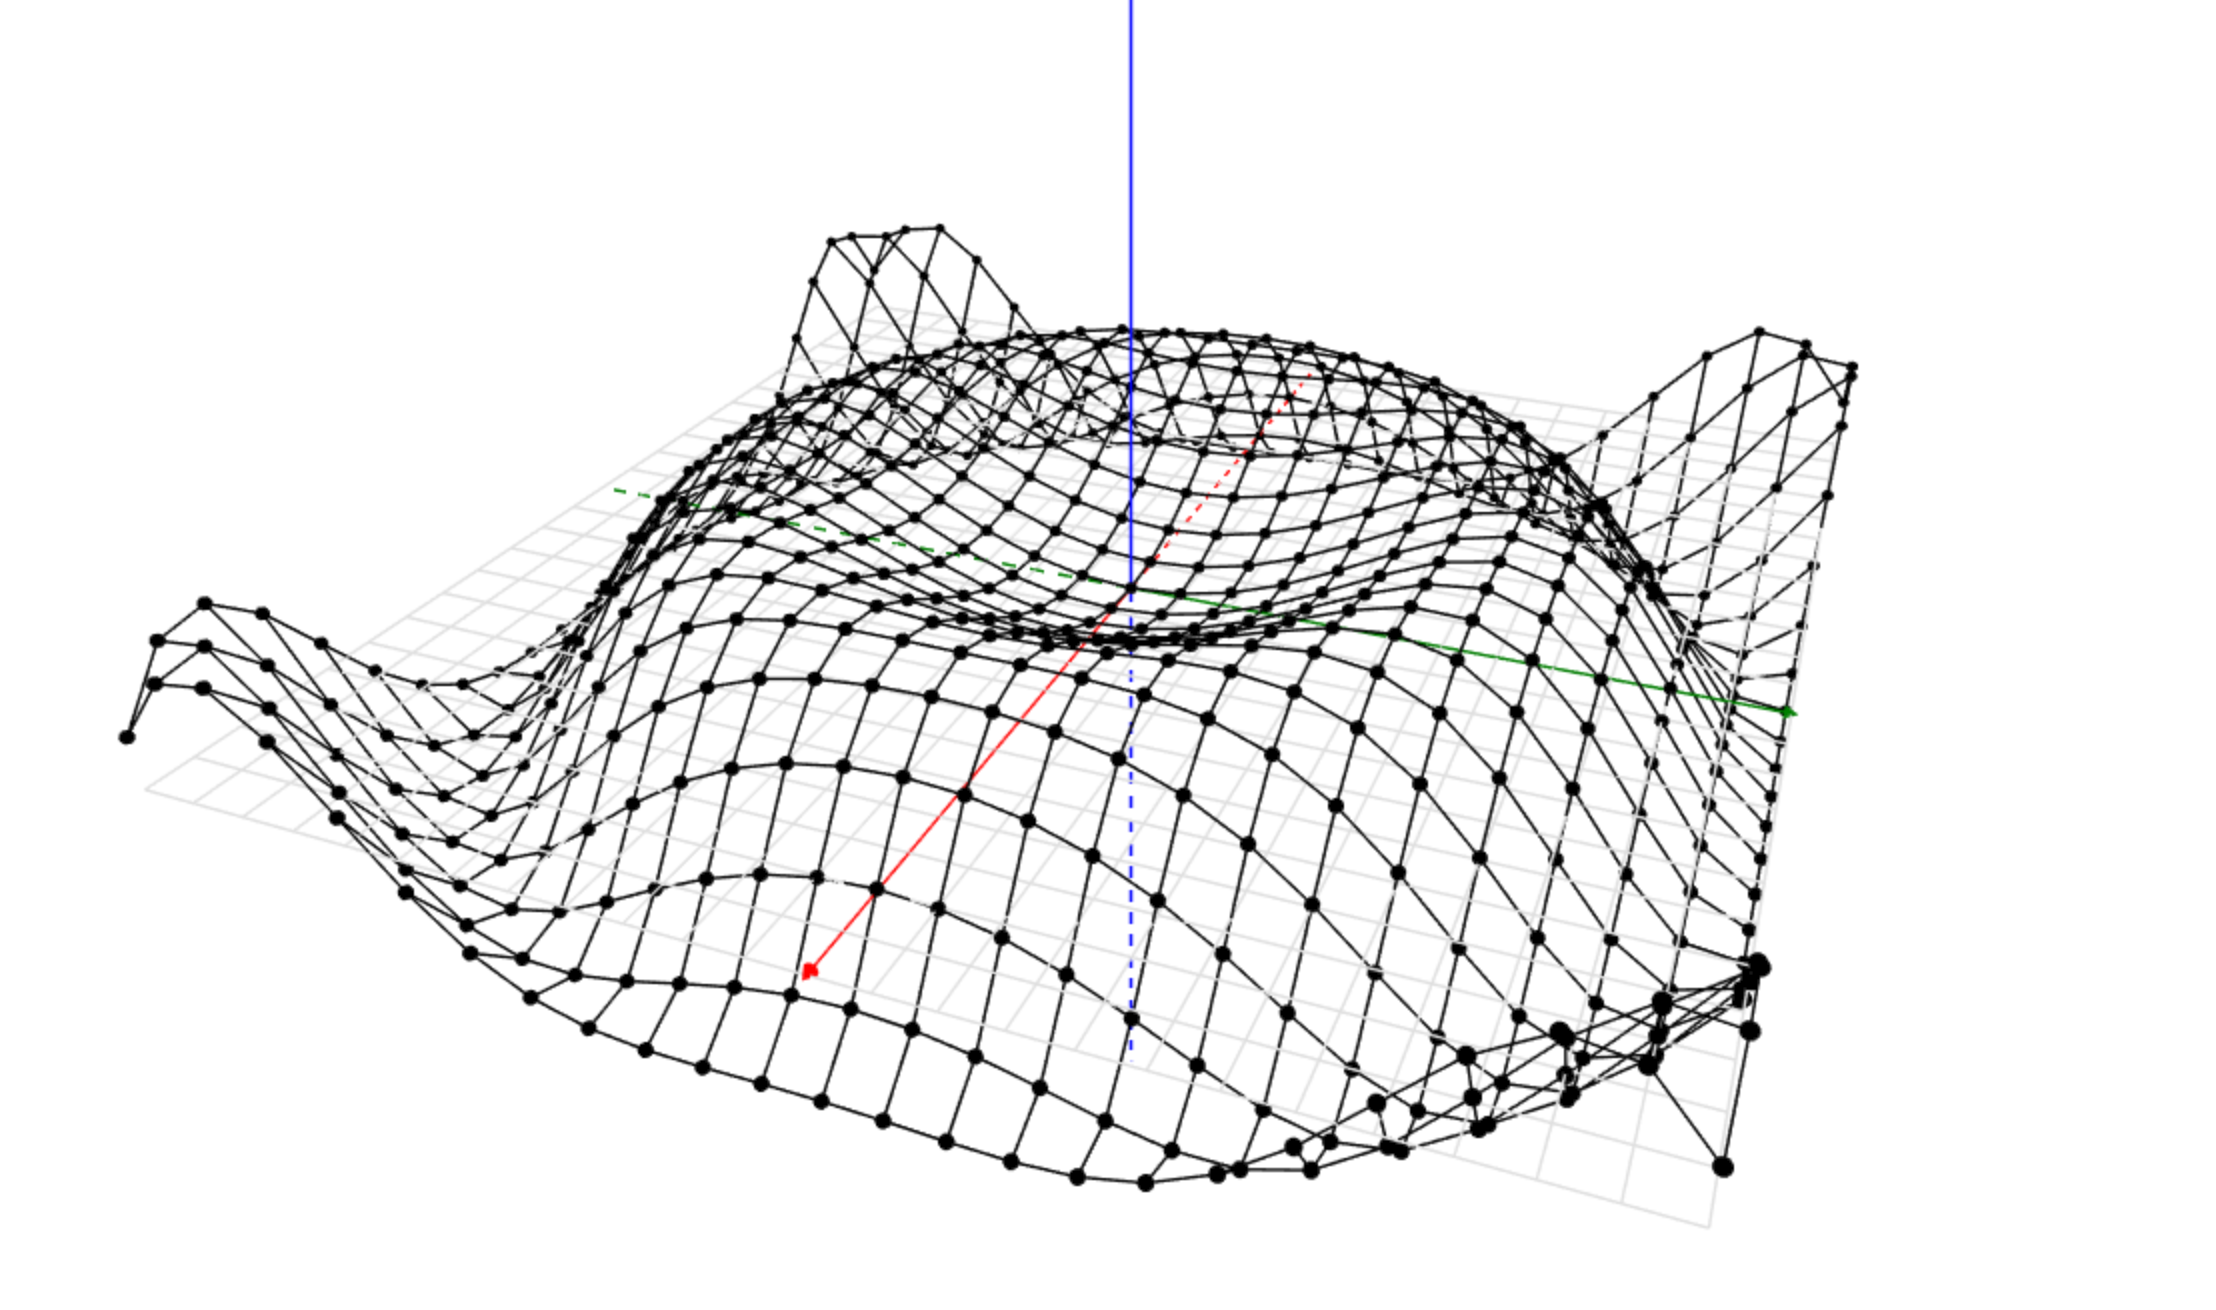
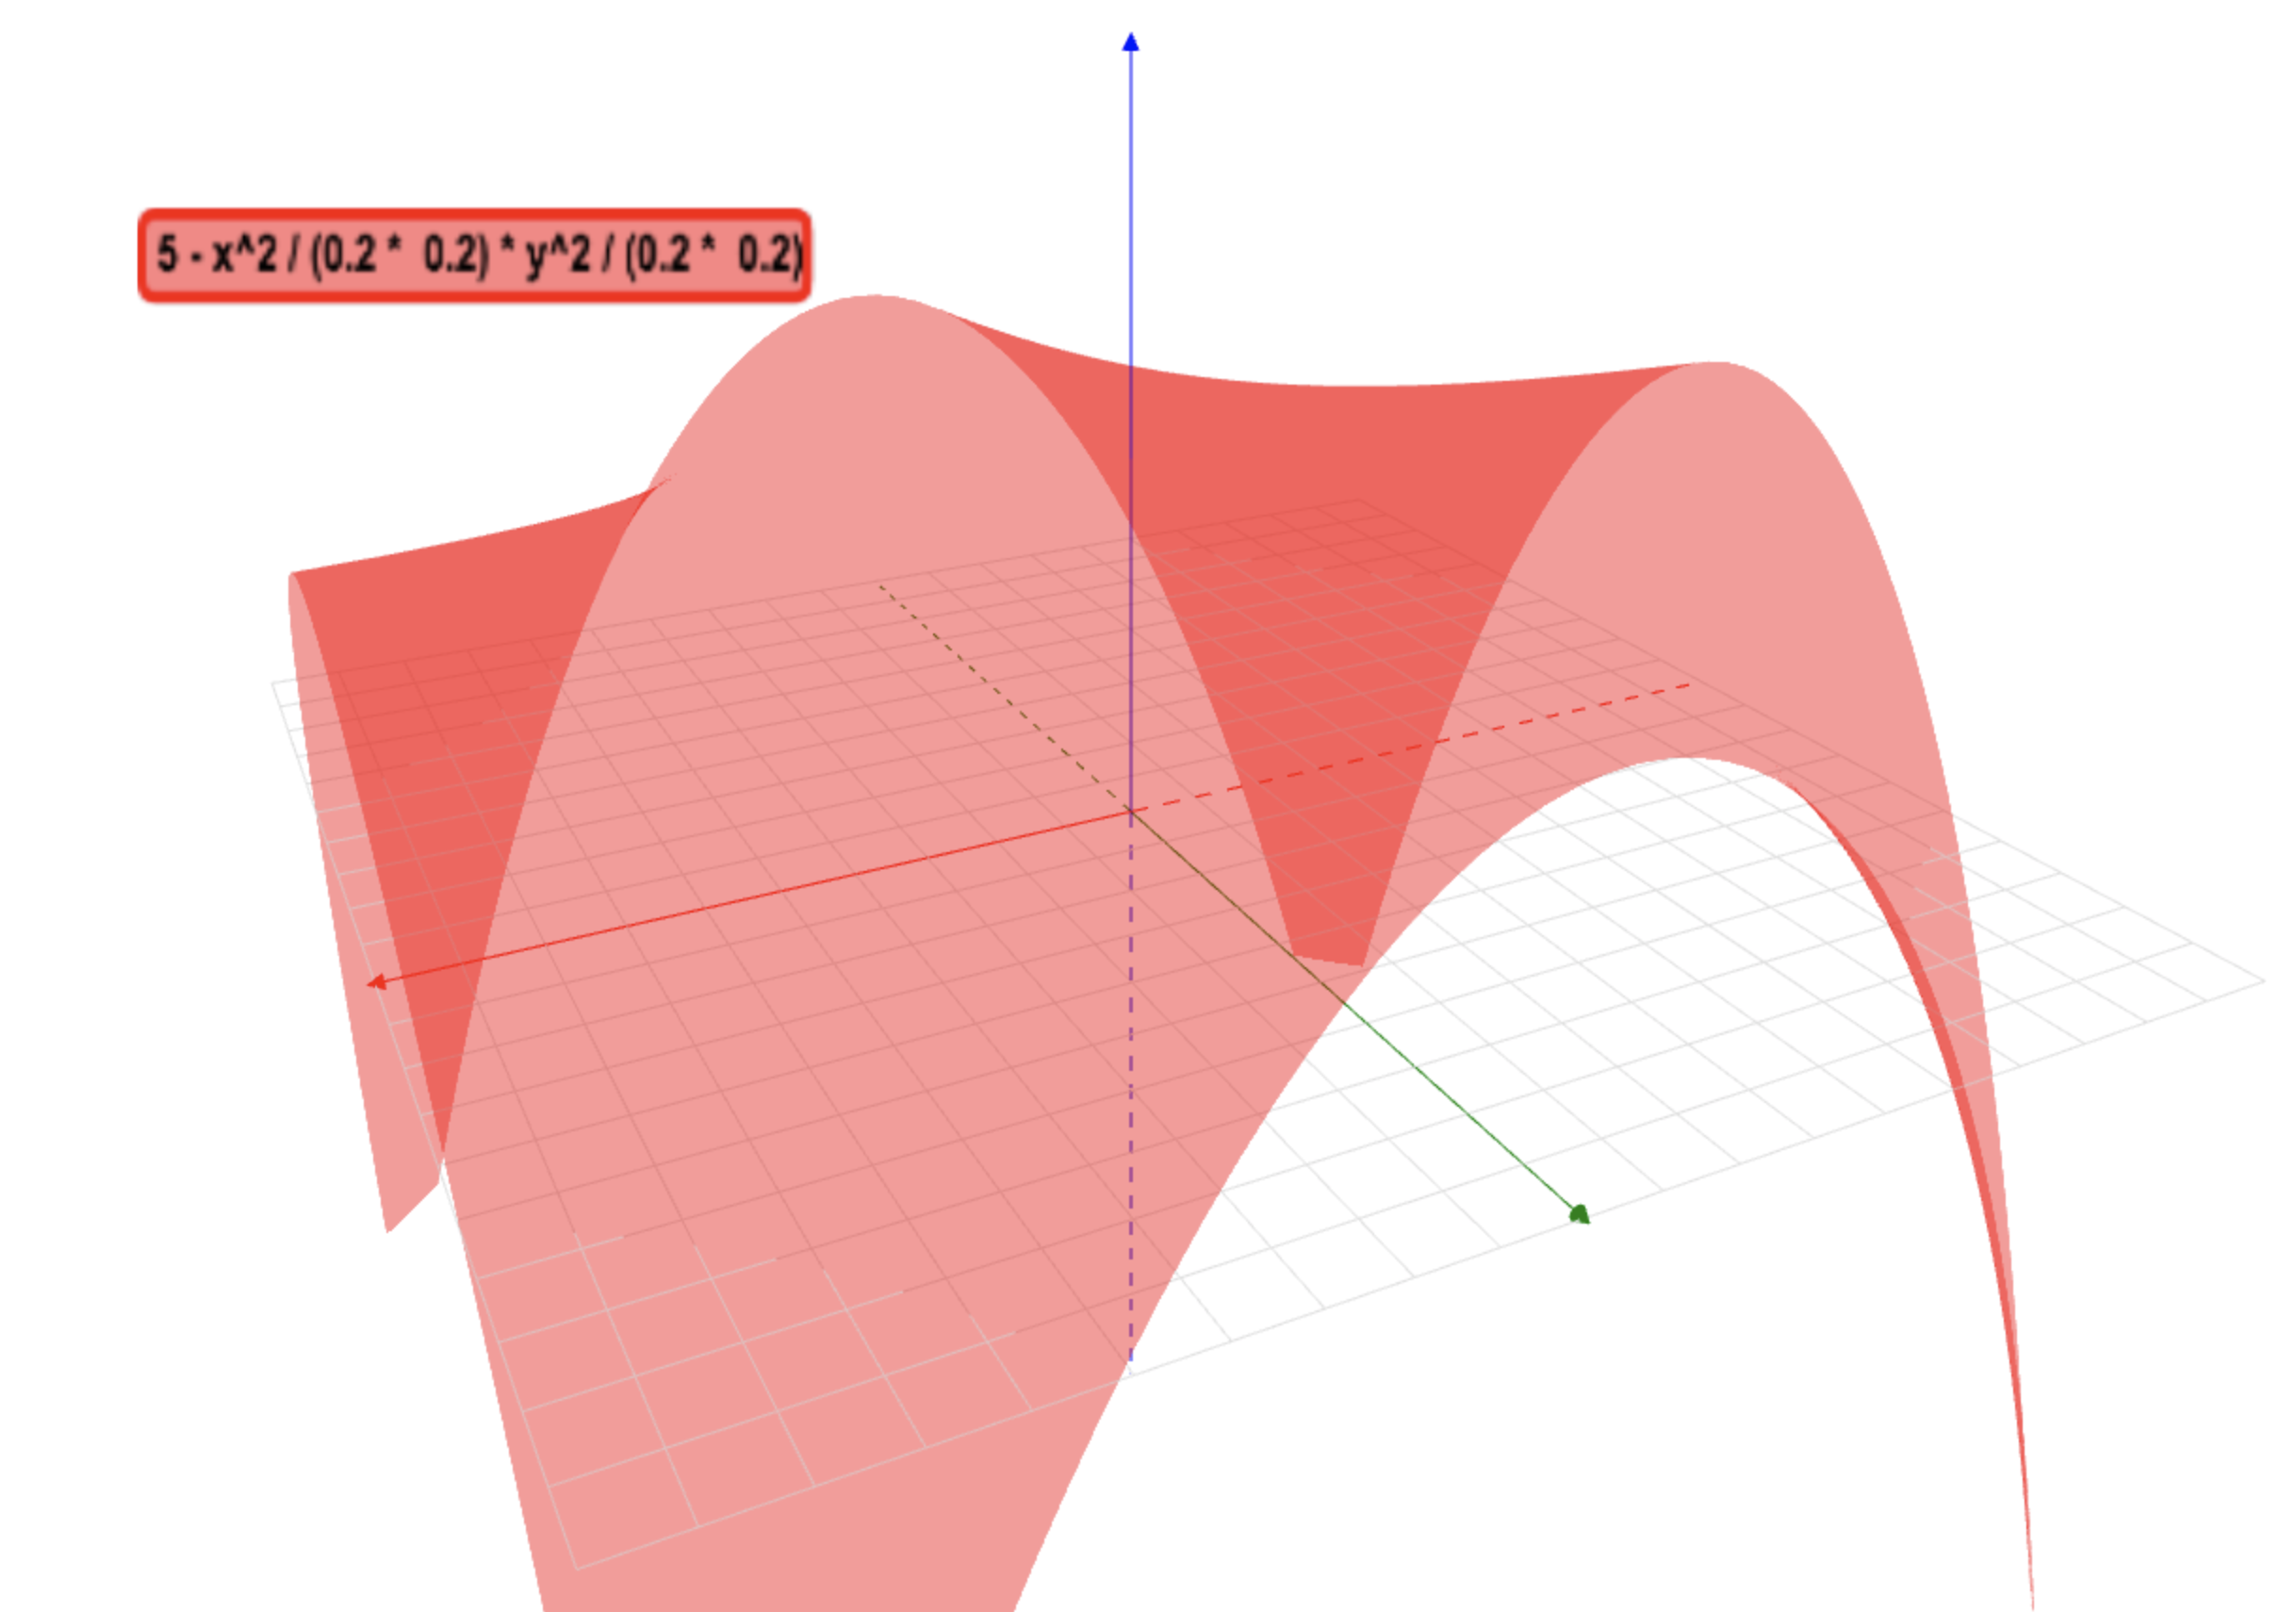
Graphing Surfaces
Demonstrates how surfaces are drawn in three dimensions.
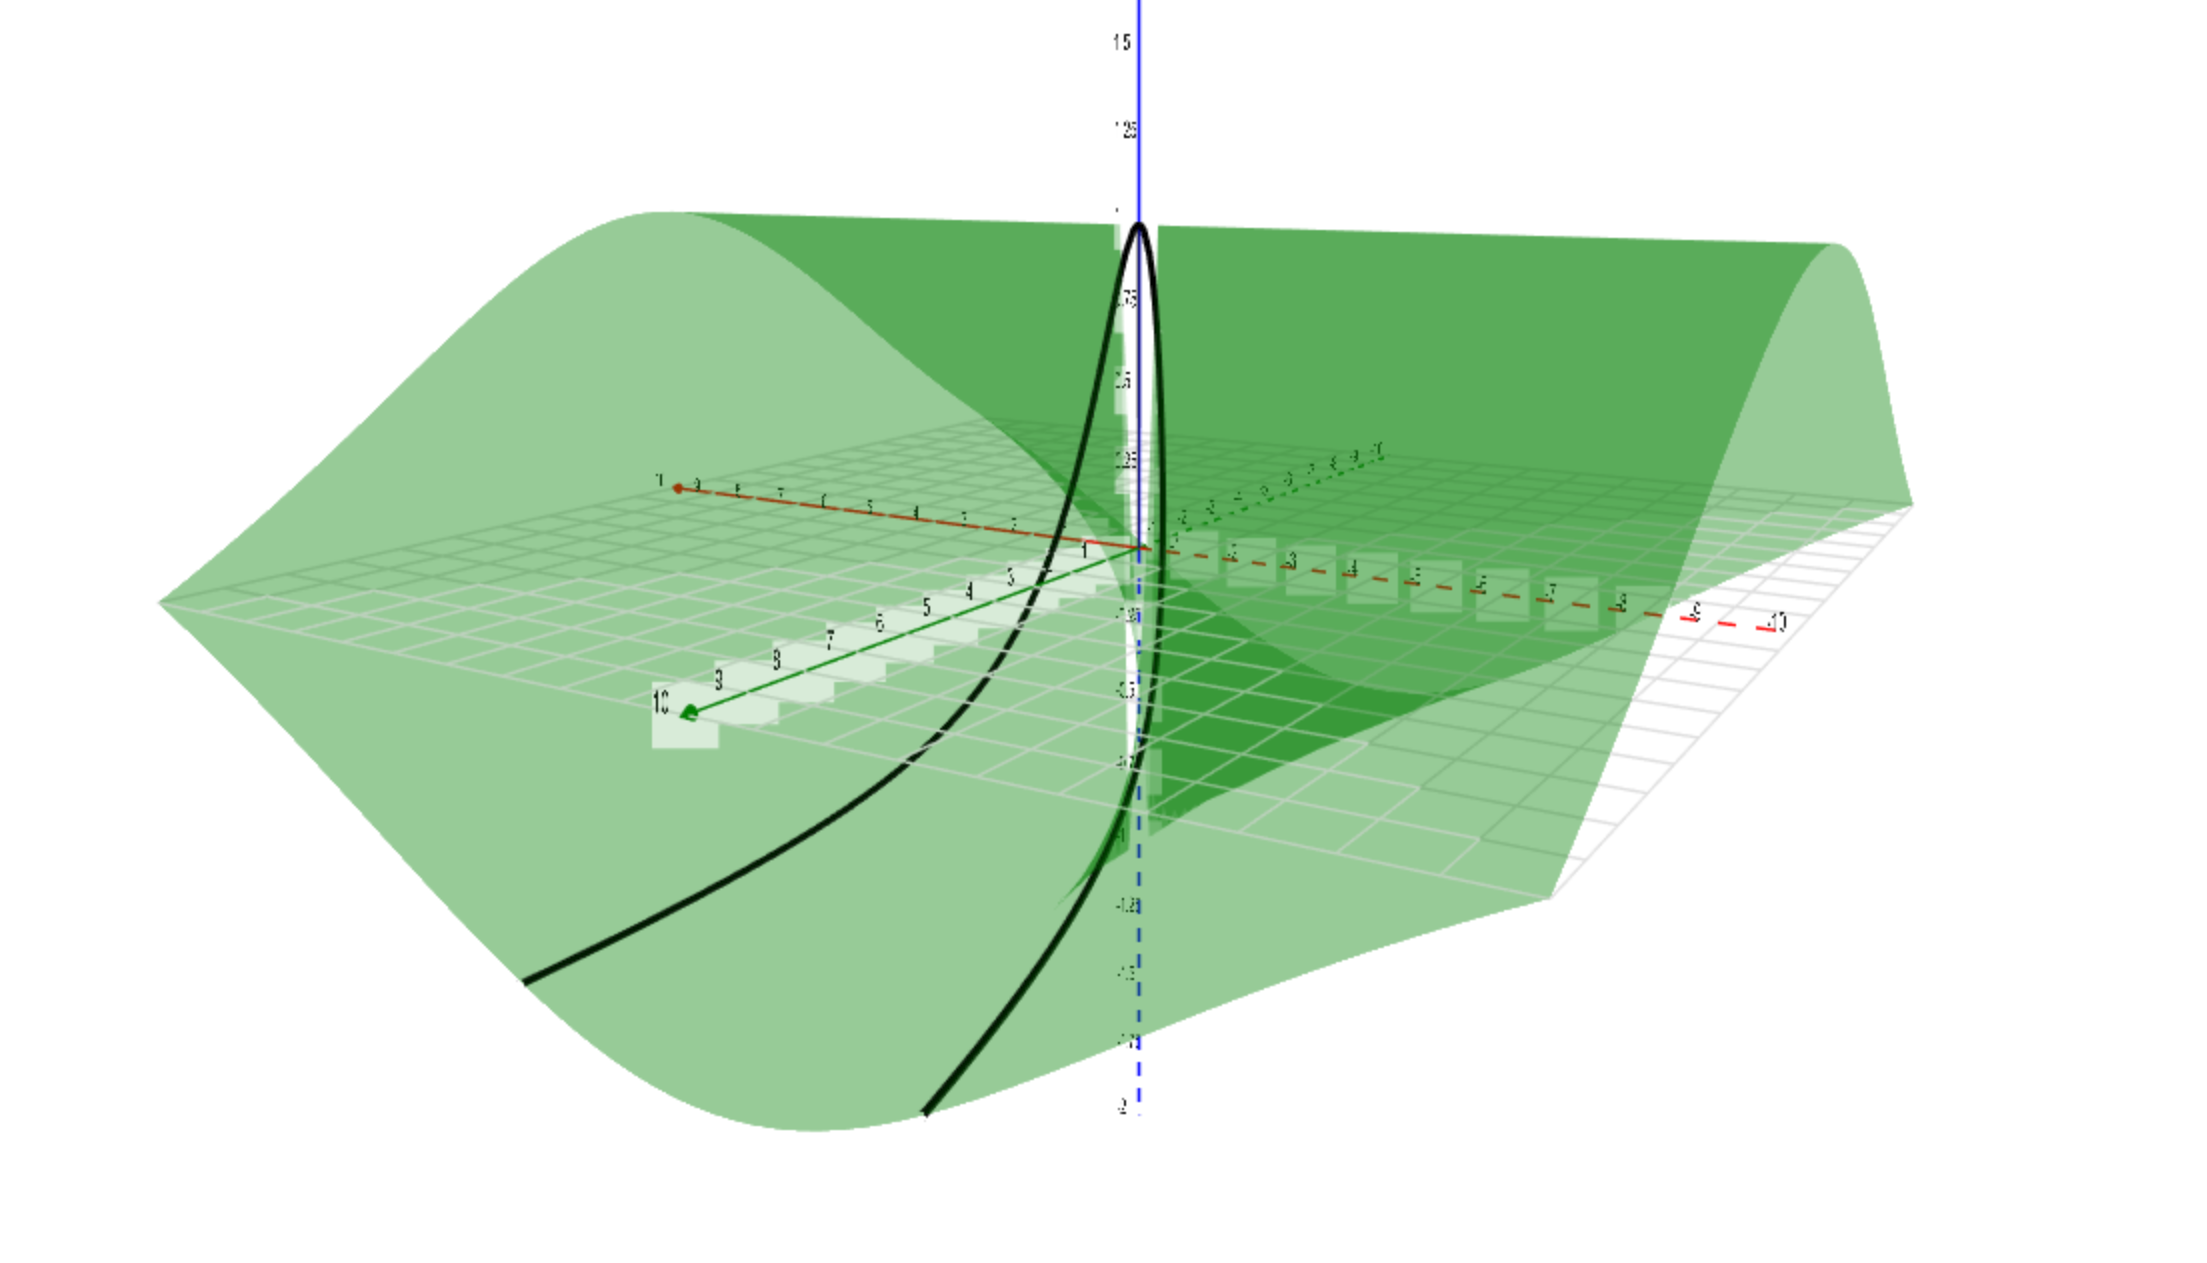
Graphing Traces
Demonstrates how graphs can be produced in three dimensions using traces.
A Limit that Exists
Shows a limit in 3D that exists, and demonstrates different paths that can be taken to get to it.
A Limit that Does Not Exist
Demonstrates a limit in 3D that does not exist and the different paths that can be taken to prove this.
Partial Derivatives and Gradients
Shows how to interpret a partial derivative, directional derivative, and gradient in three dimensons.
4D Graph
Demonstrates a graph of a 4-dimensional surface by allowing a 3d surface to change over time.
3D Grapher
Allows user to plot points, vector-valued functions and z=f(x, y) functions in a 3-dimensional system.
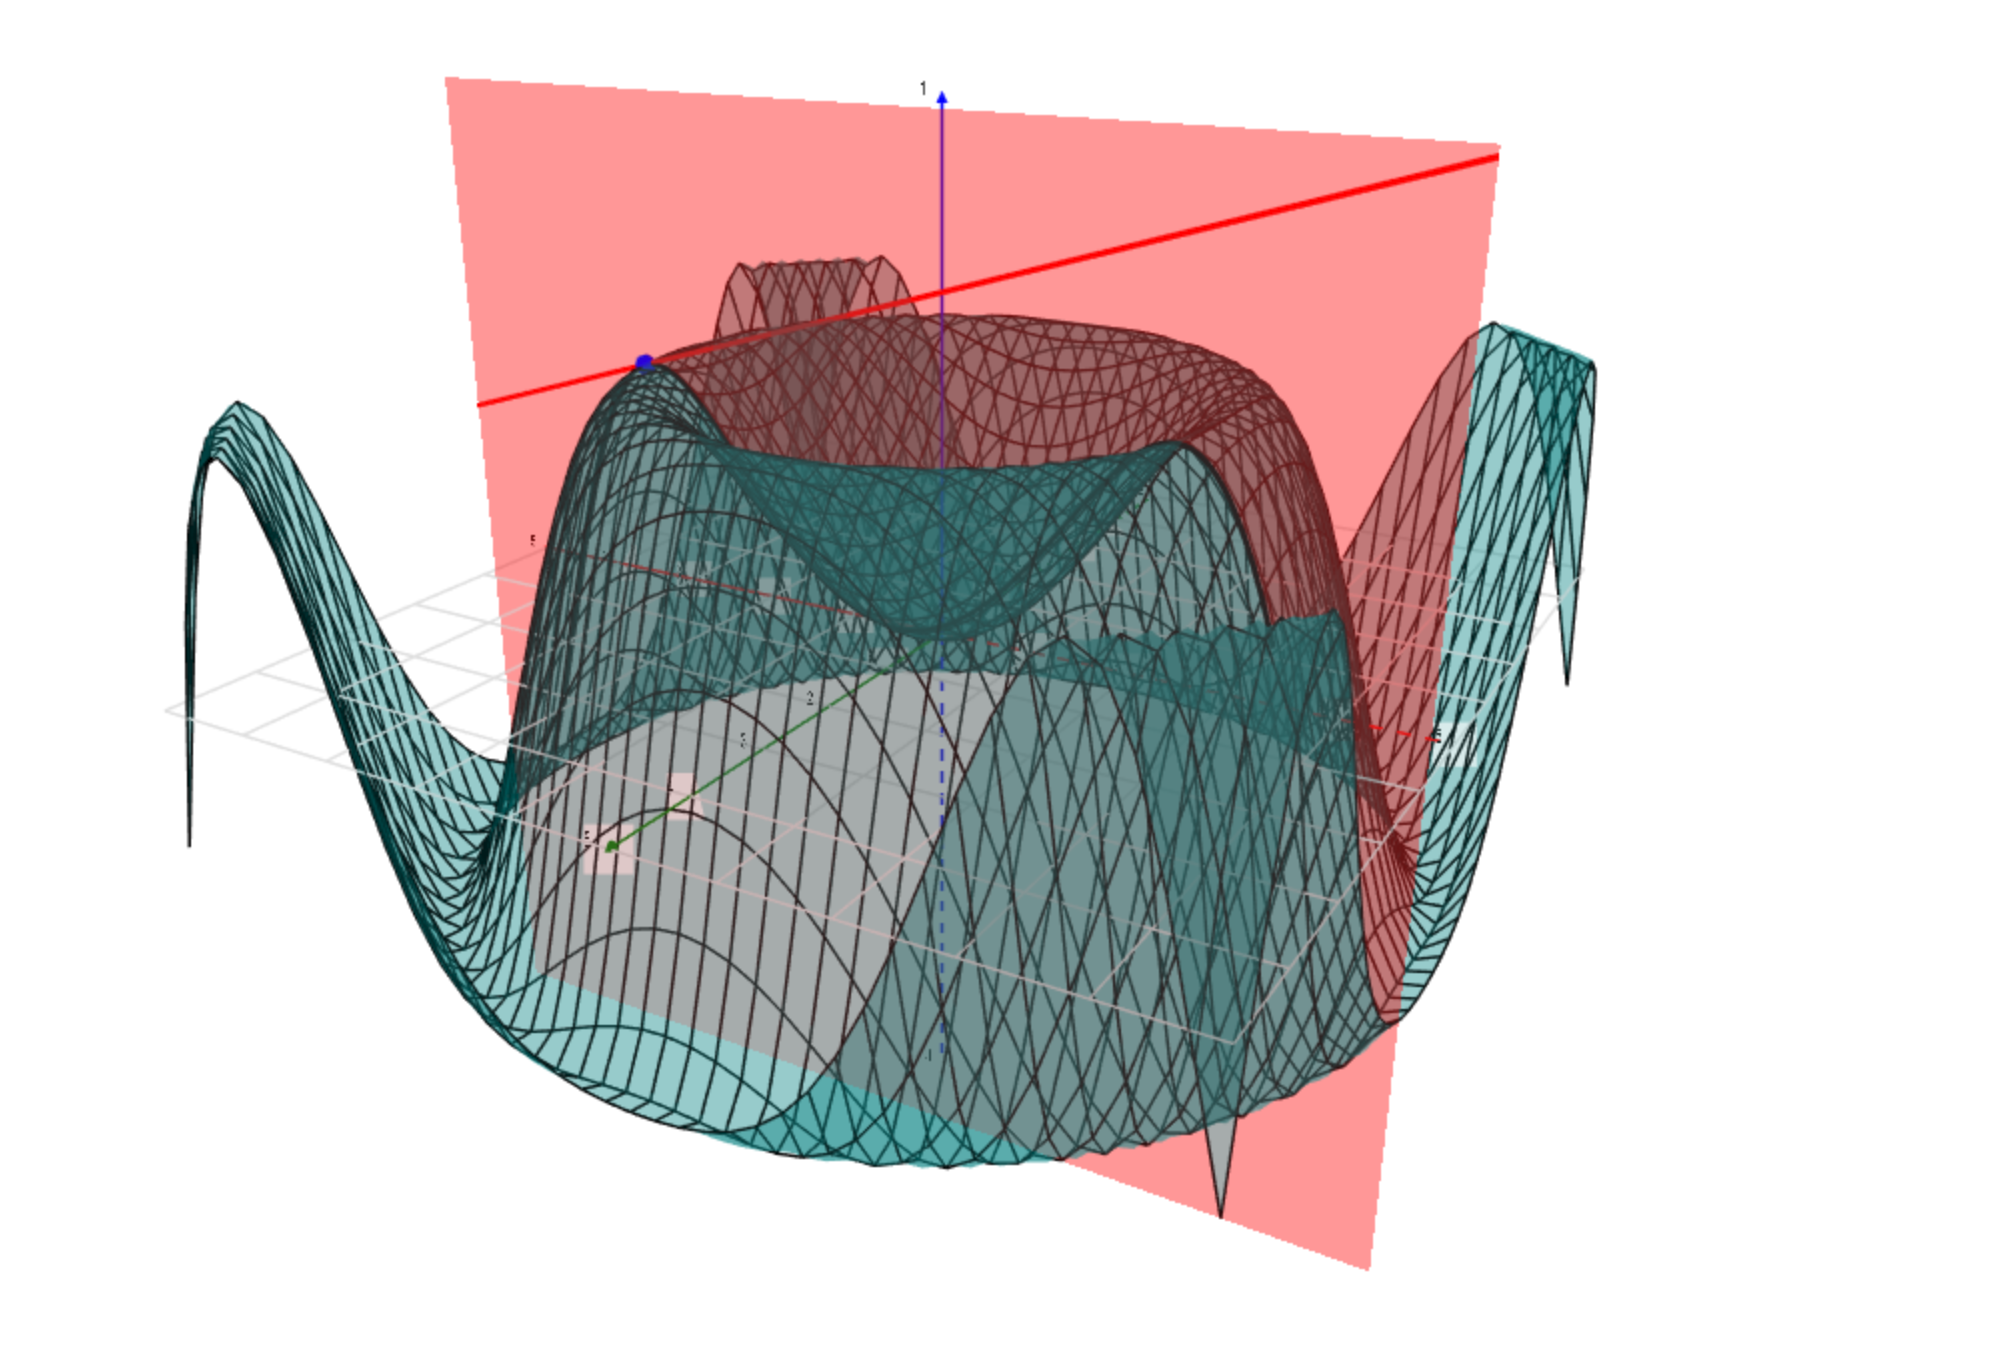
Absolute Extrema
Demonstrates the necessity of testing for absolute extrema along the boundaries of a region, at the intersection of a region and within a region for extreme values of a function.
LaGrange Multipliers
Demonstrates the concept of finding a minimum distance using LaGrange Multipliers.
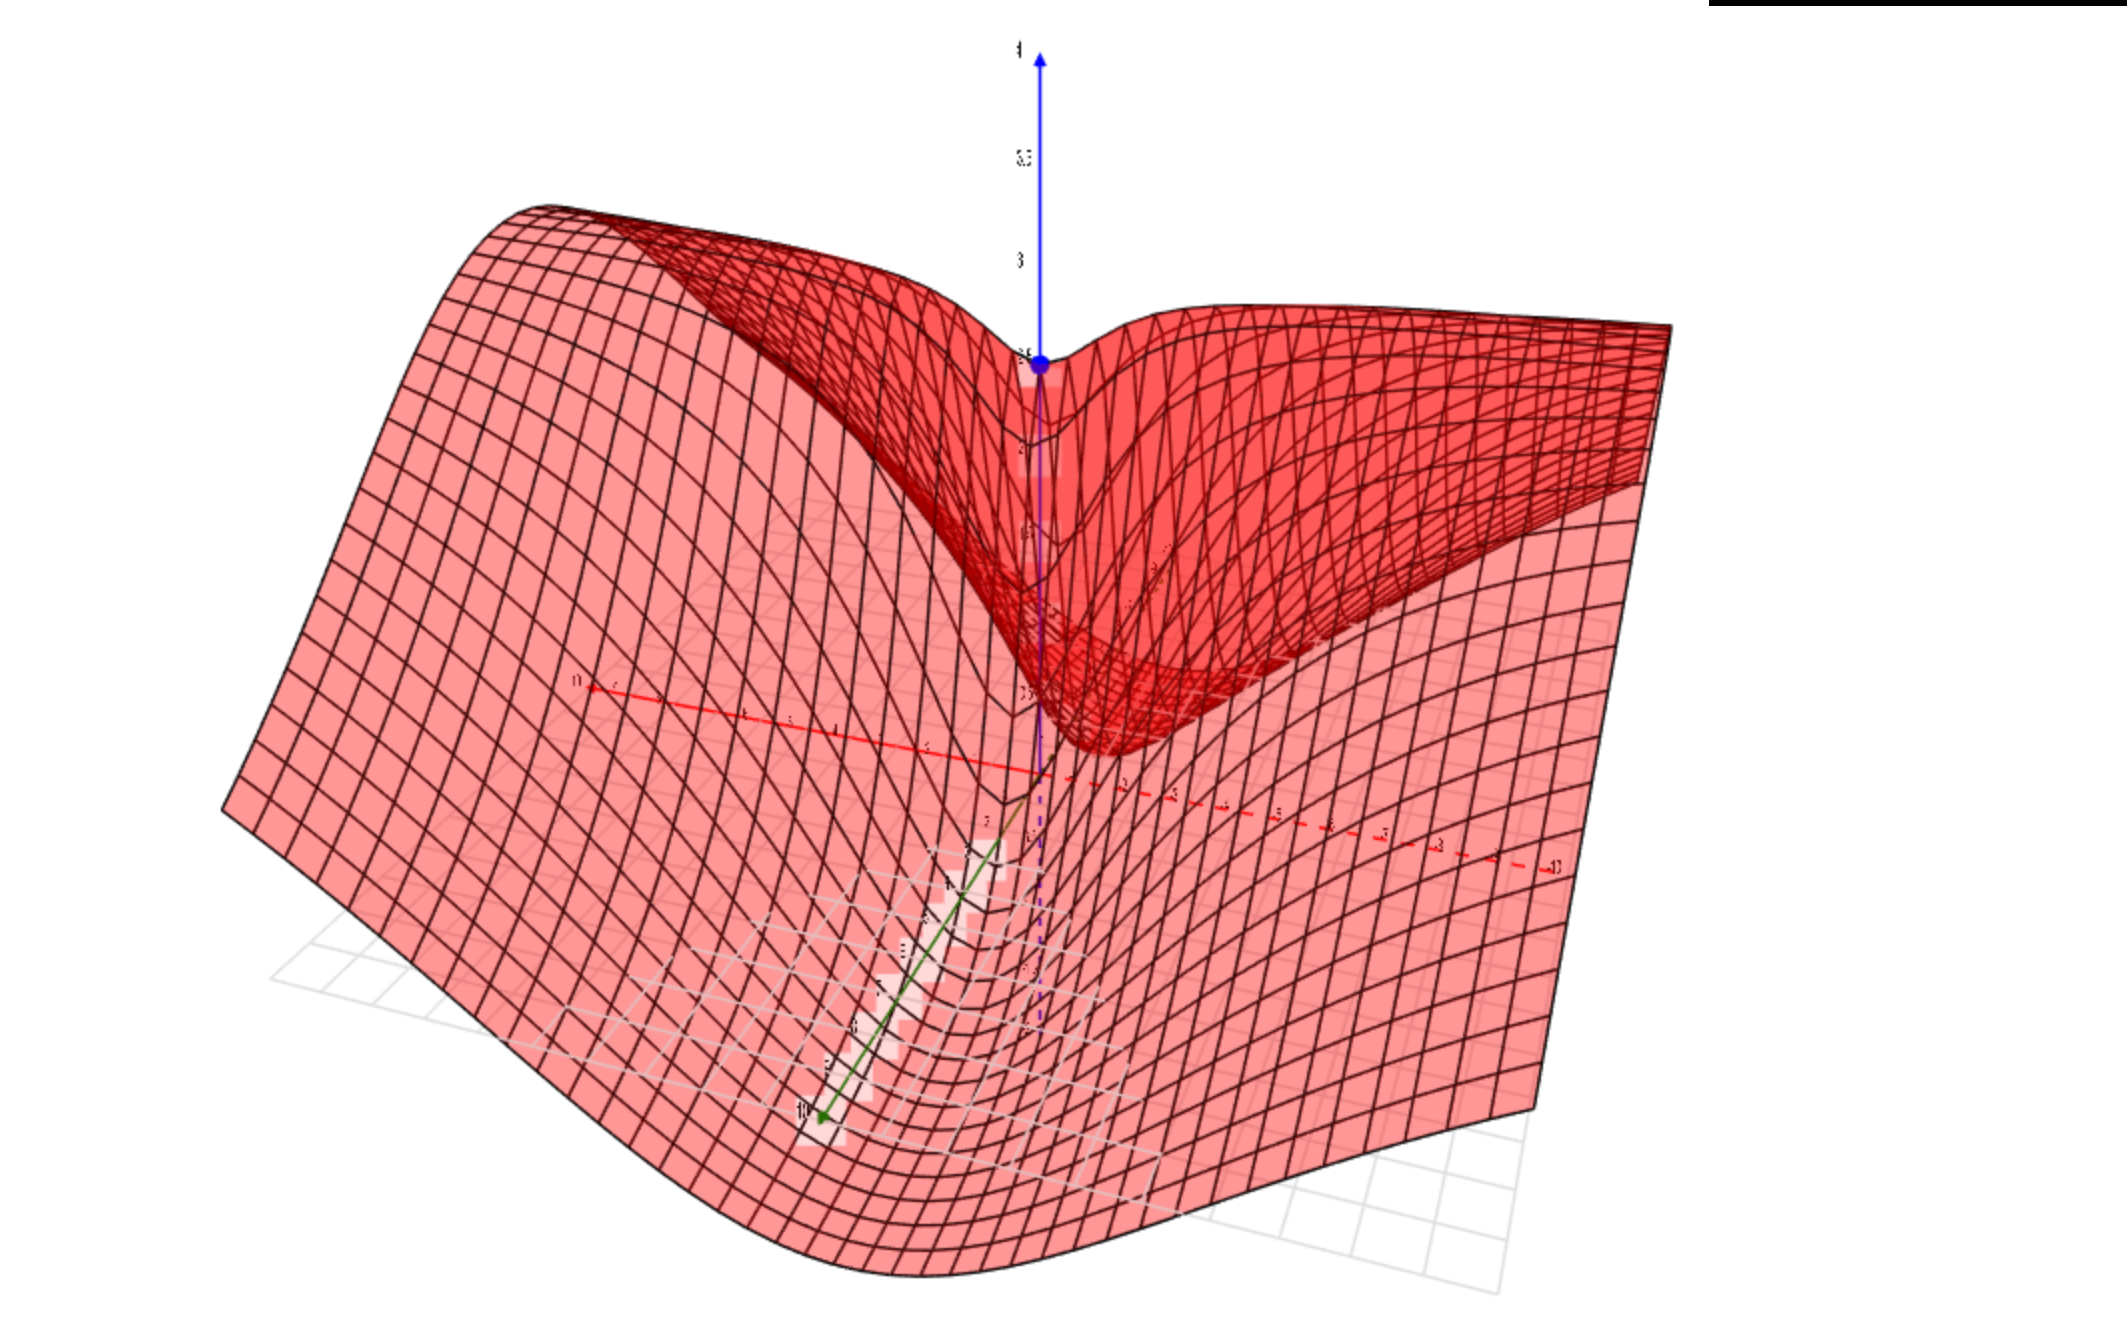
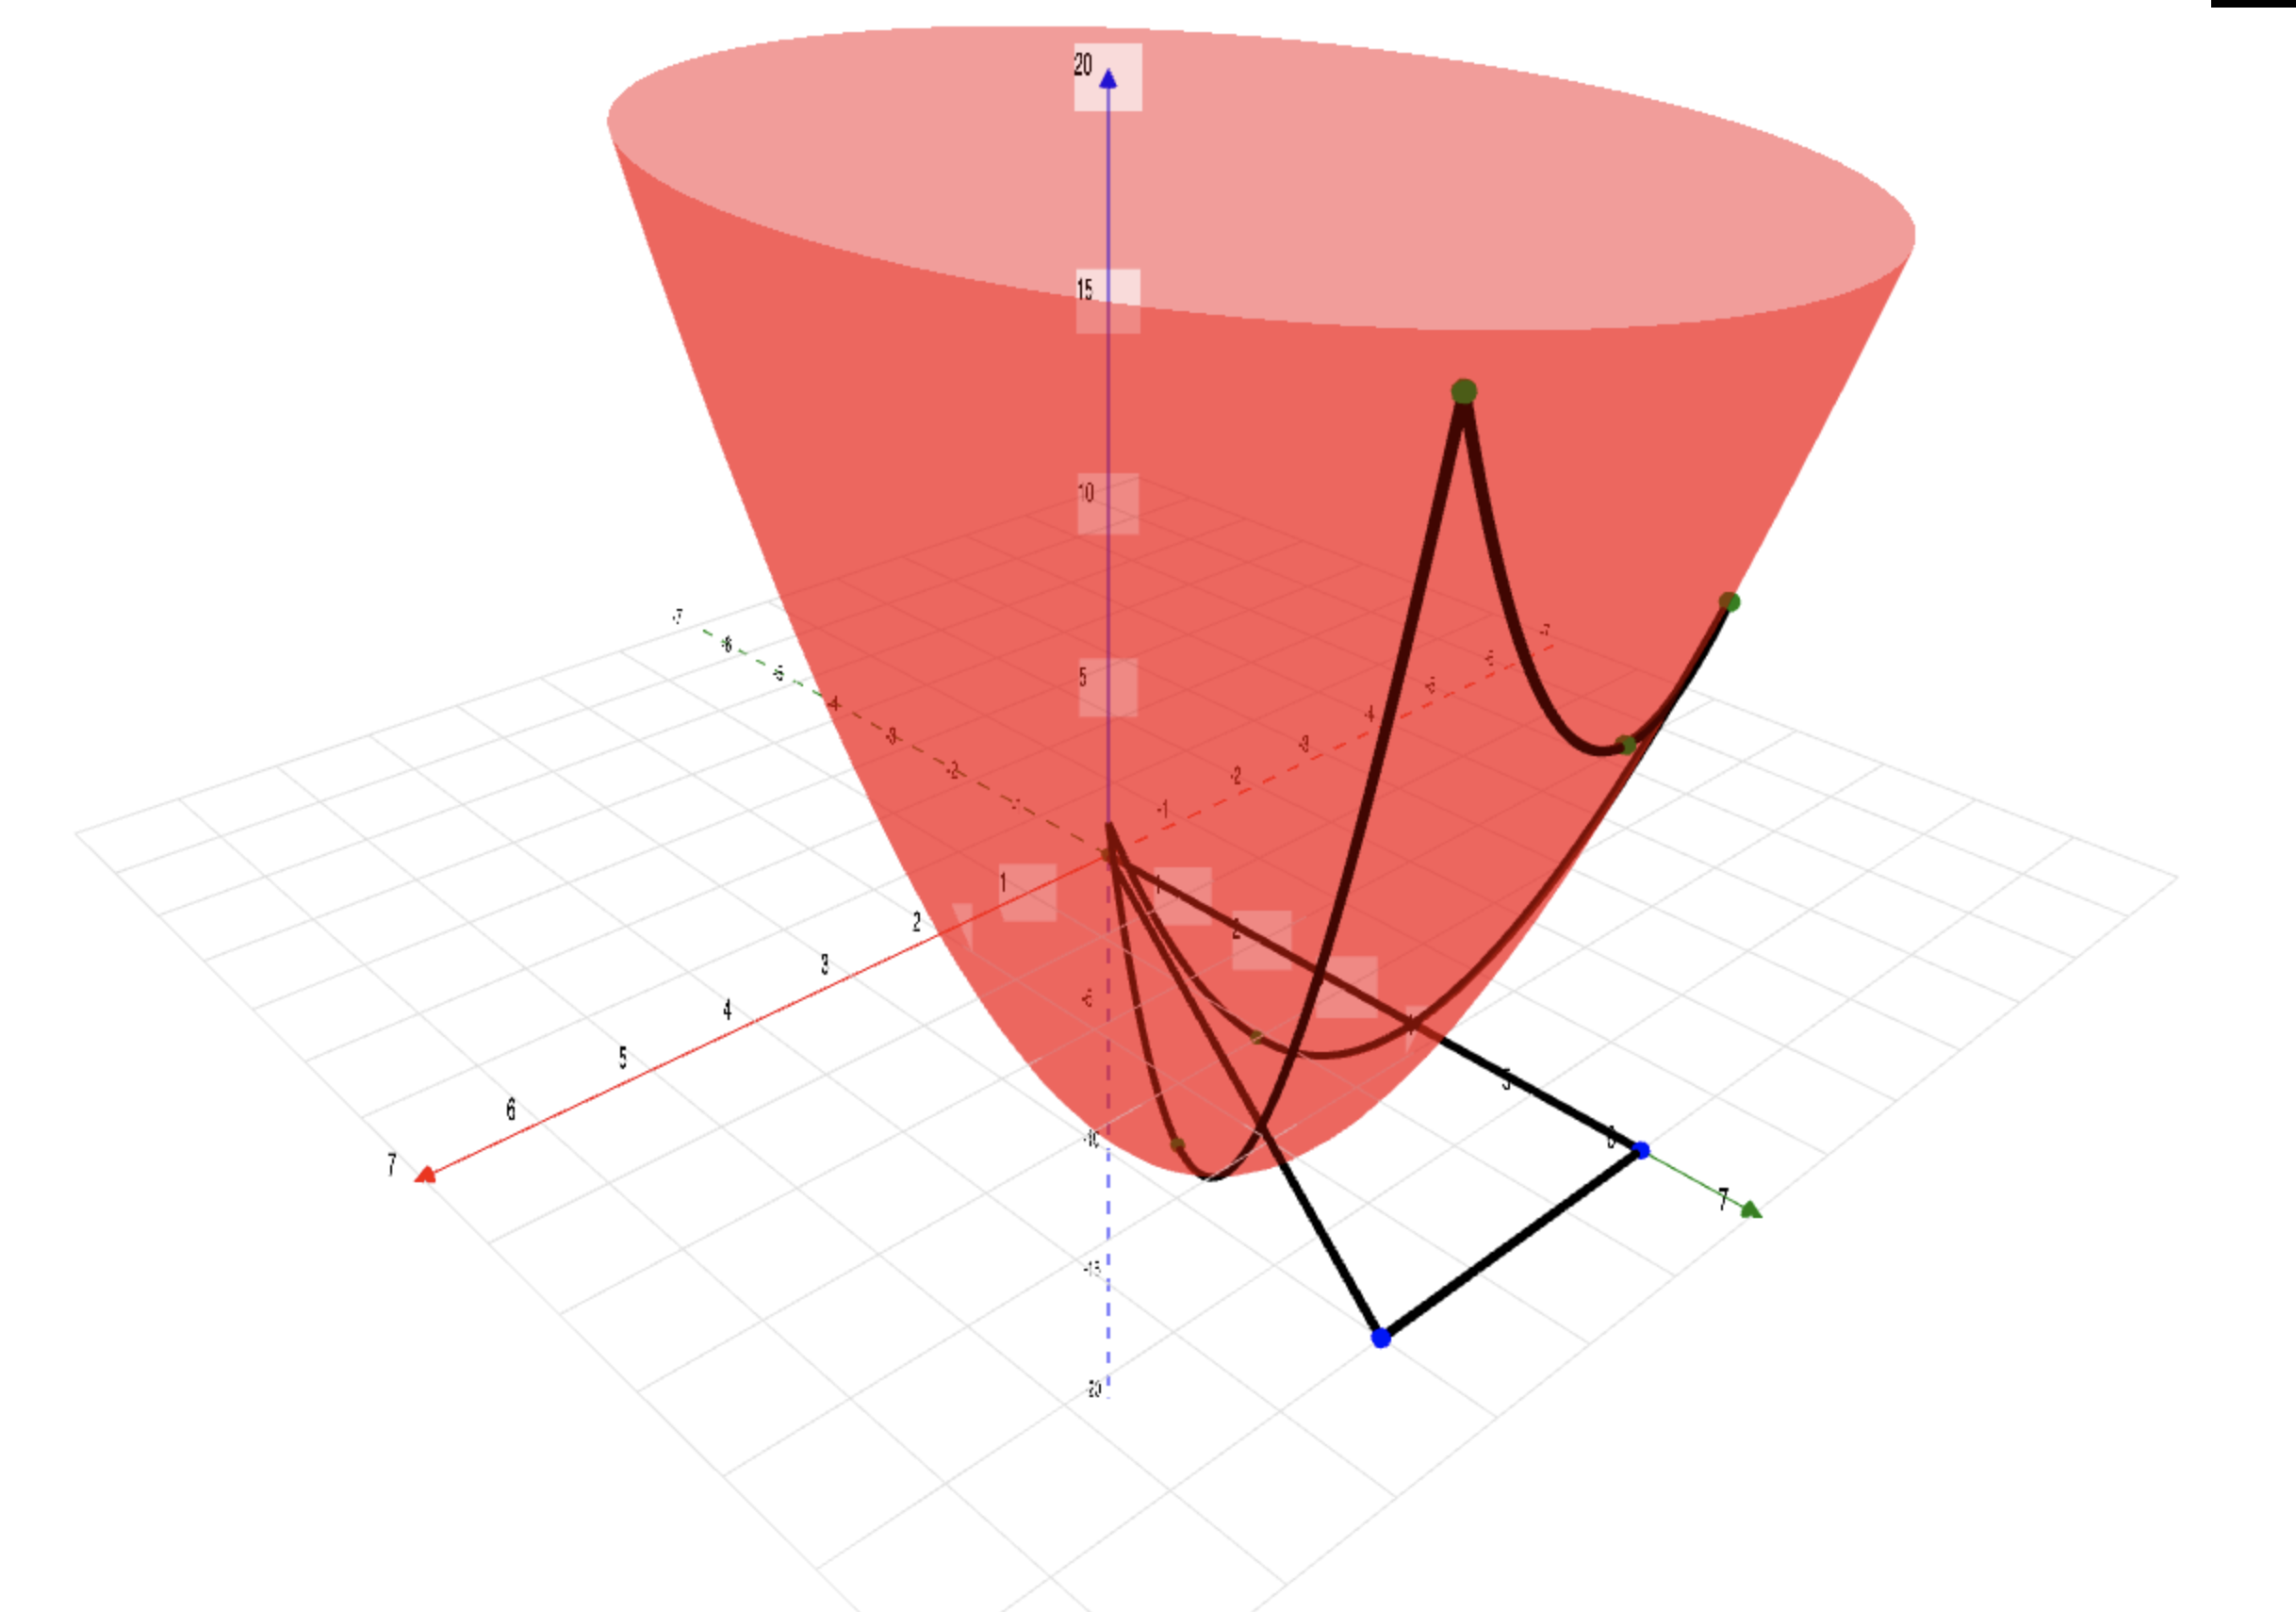
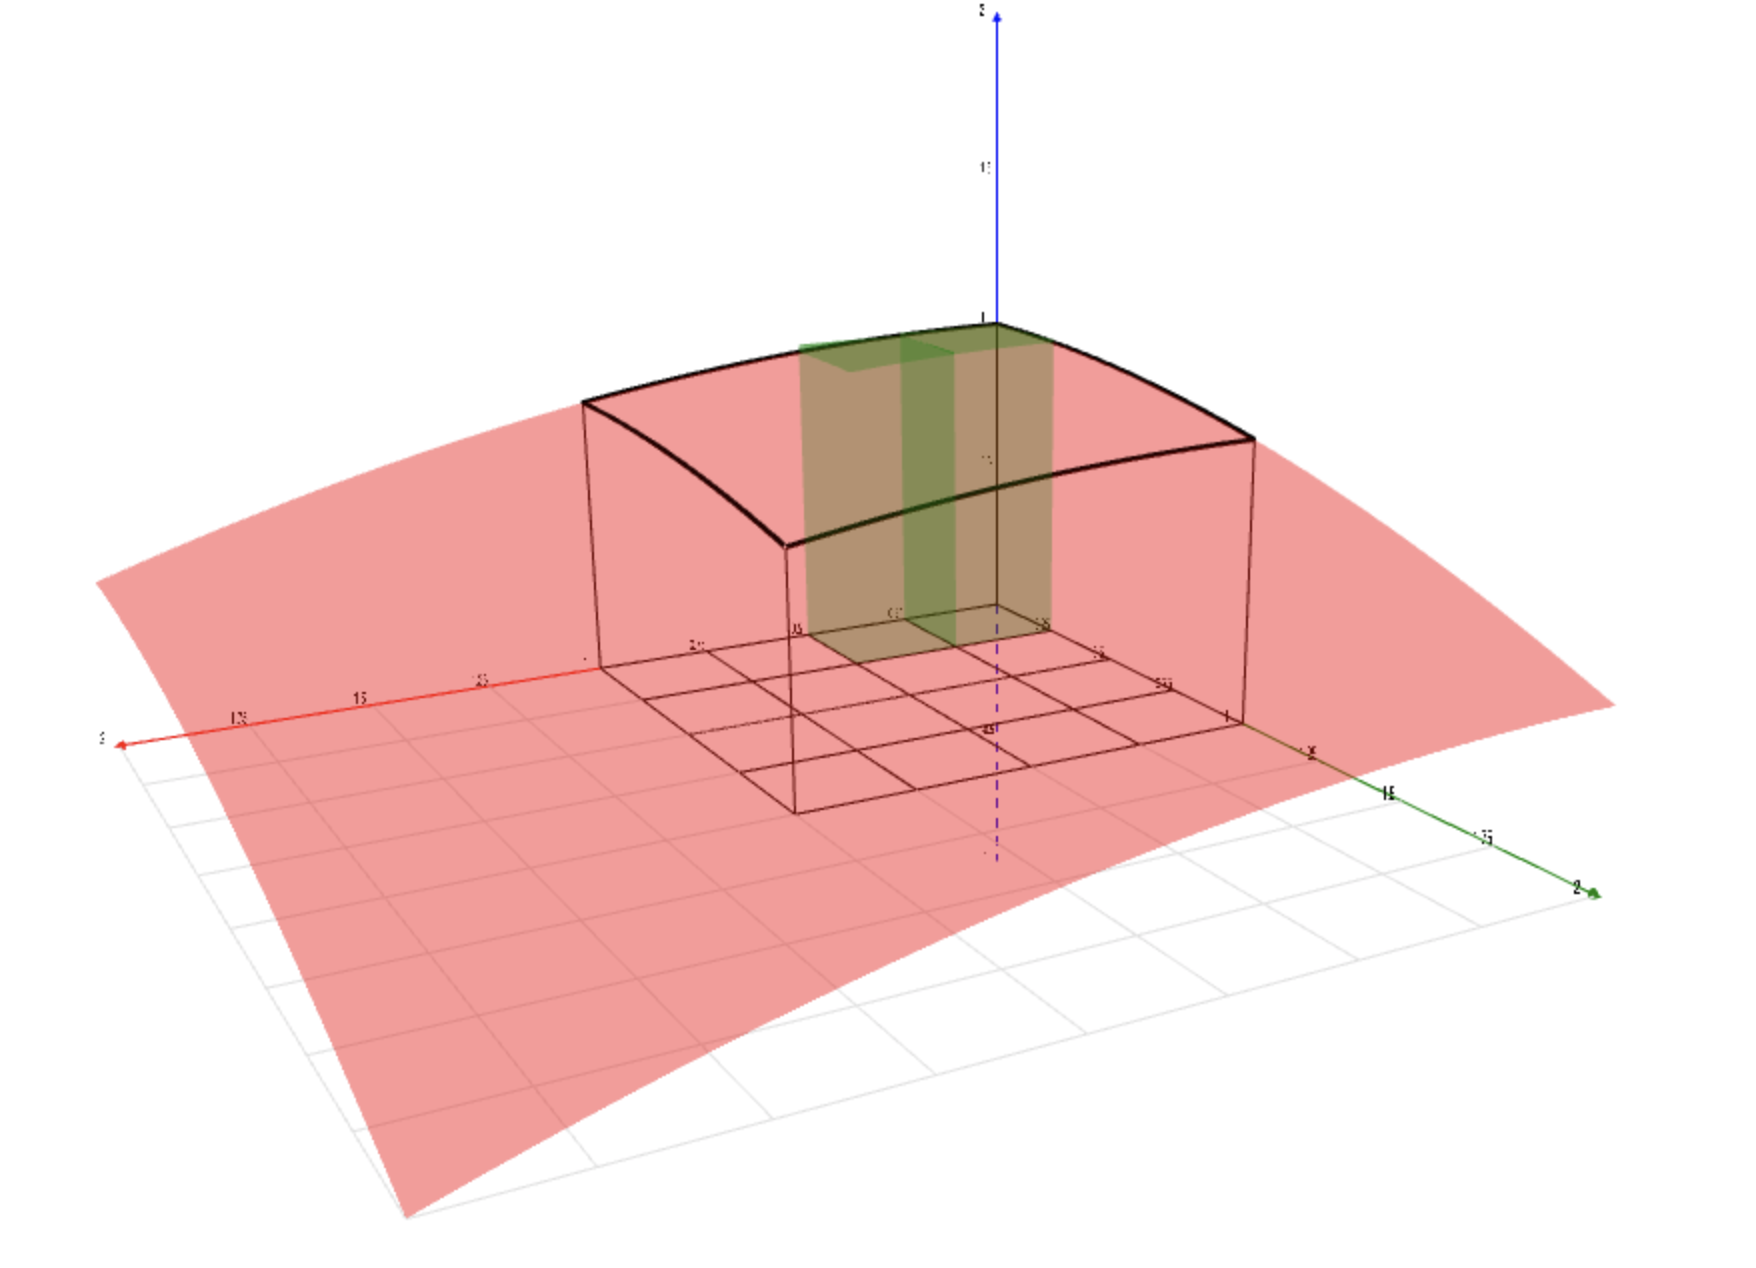
Calculating Volume Using a Double Integral
Demonstrates how the volume of a solid trapped between a surface and the x-y plane can be calculated using a double-integral.
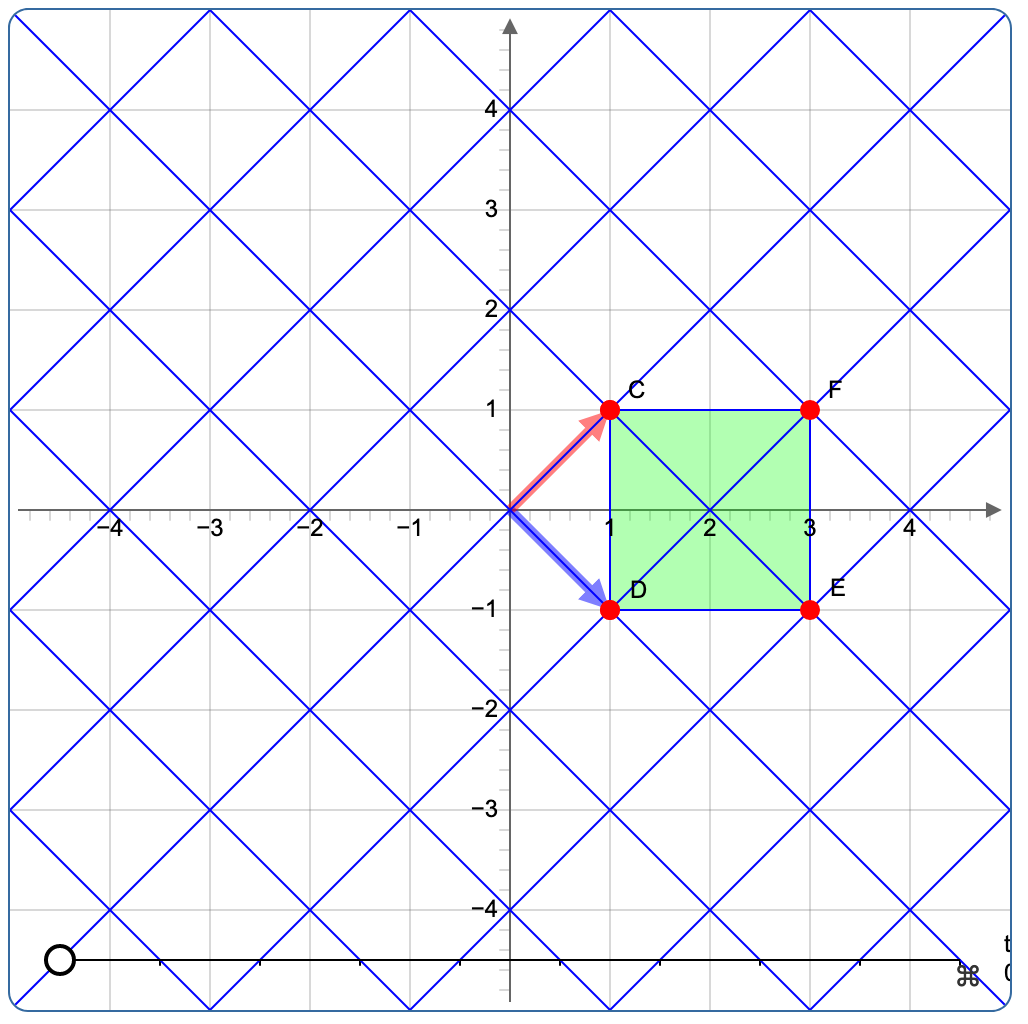
Linear Transformations
Allows the user to see the effect of a linear transformation on a defined region in order to view the effect of the Jacobian on that region.
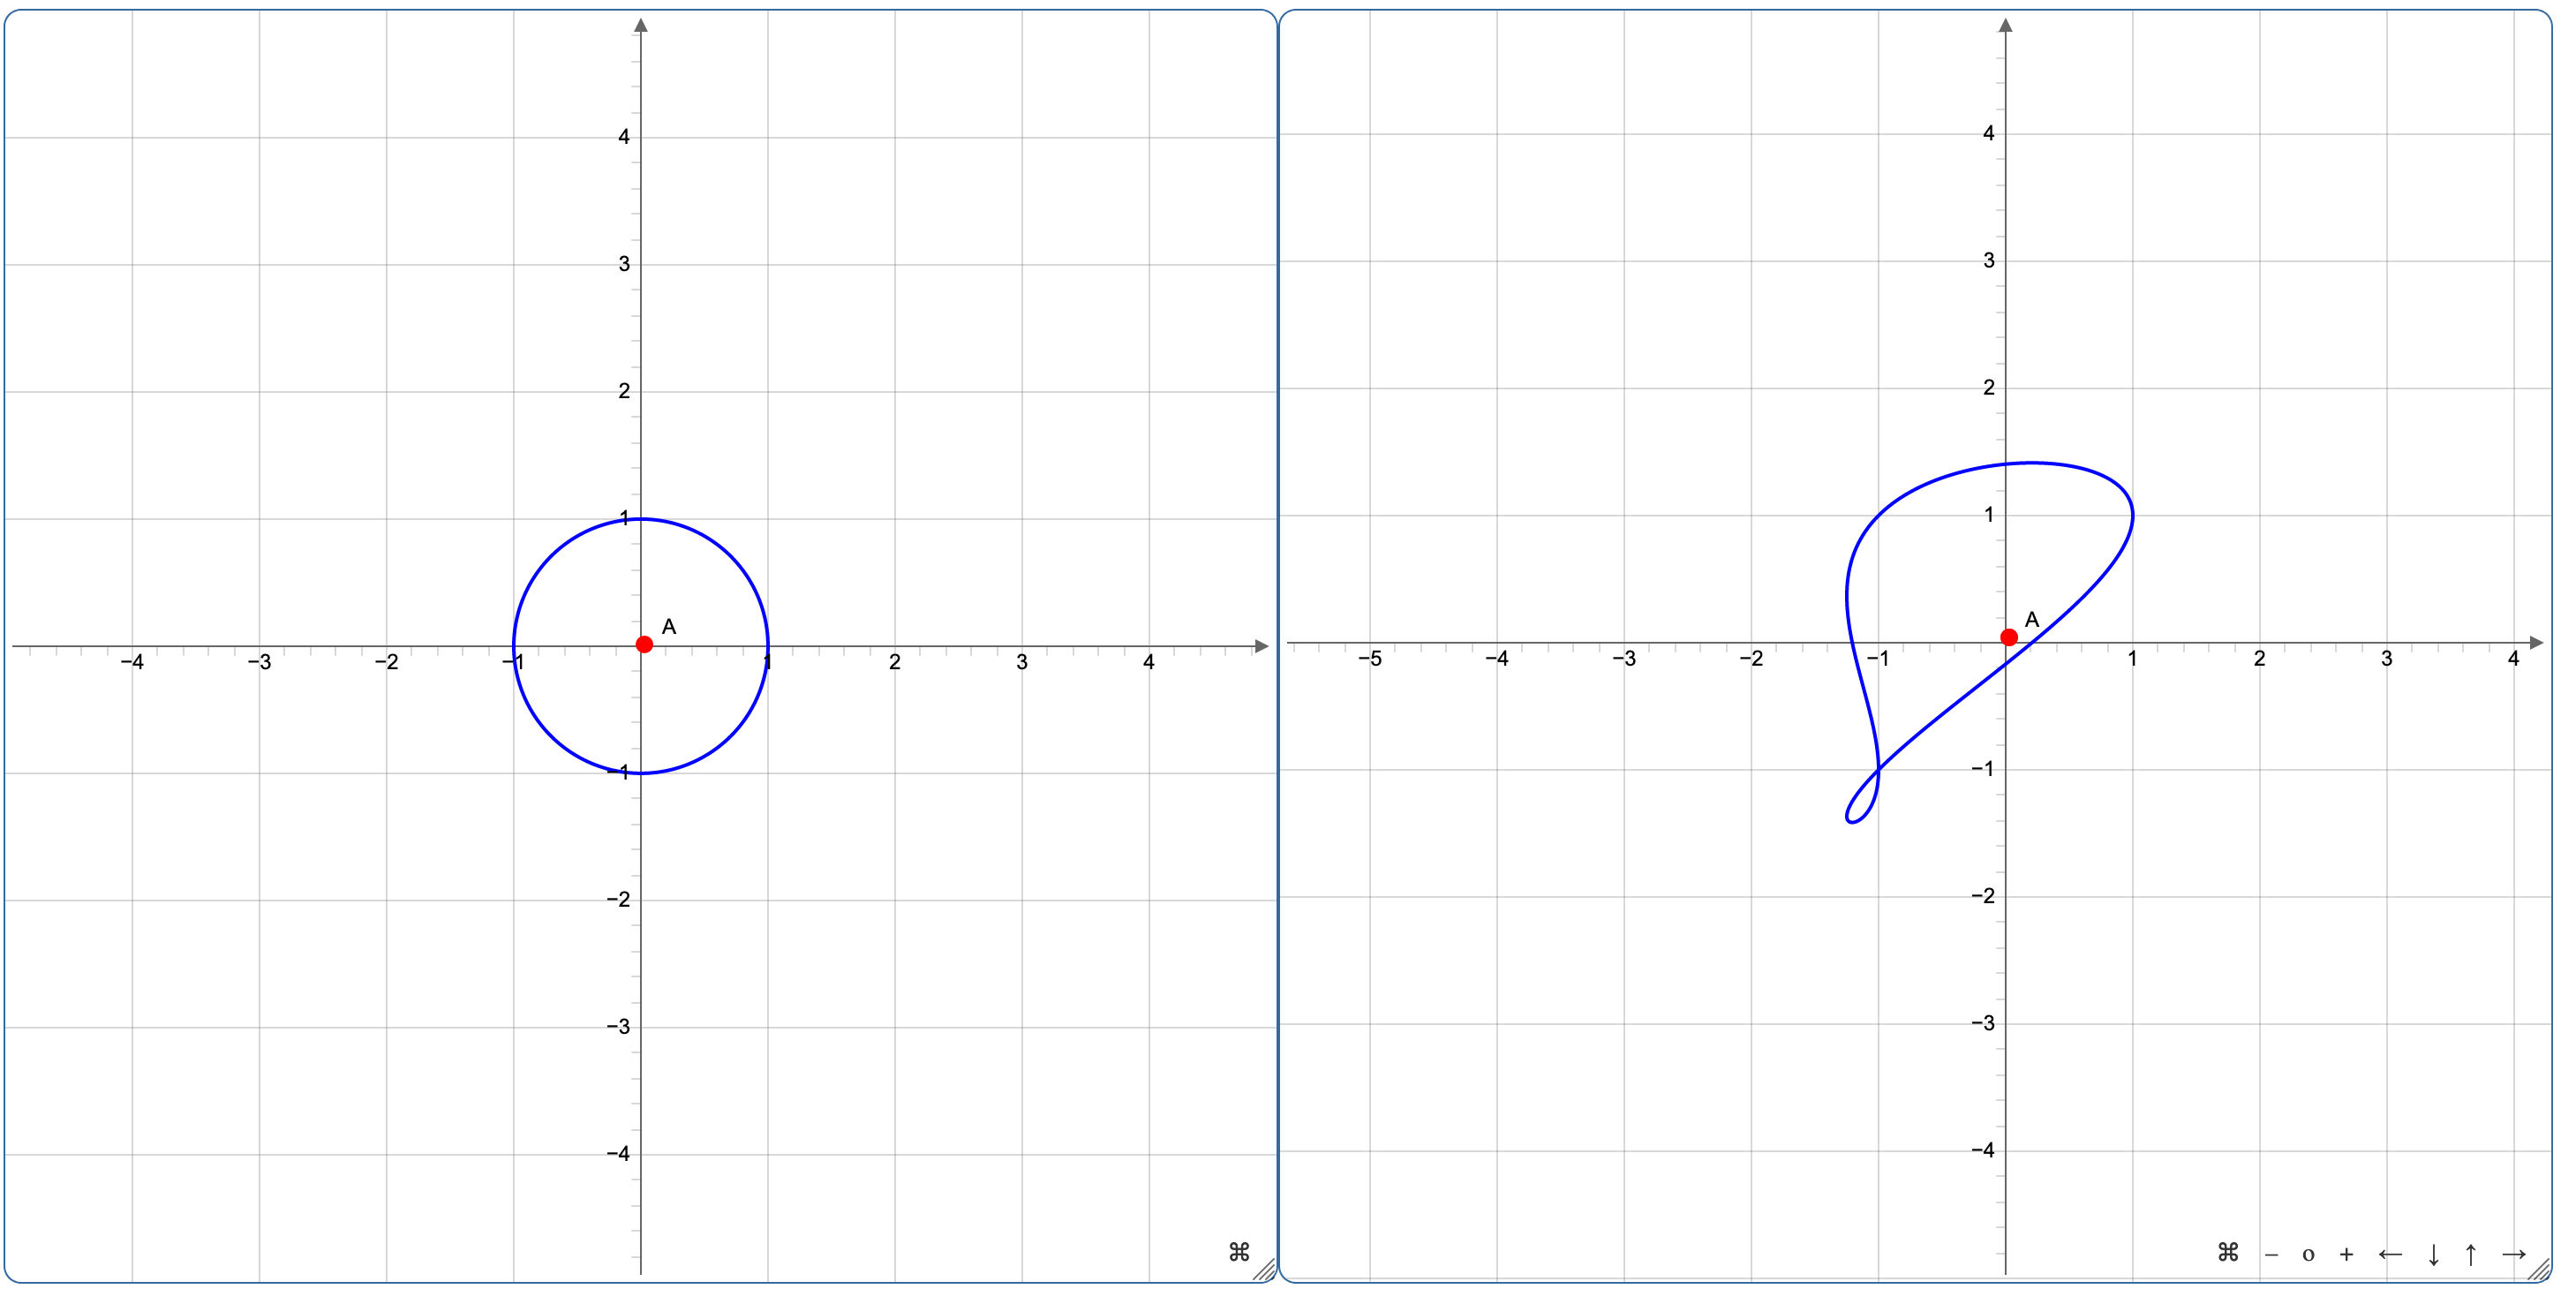
Non-Linear Transformations
Allows the user to see the effect of a non-linear transformation for points and relations within a system based on given
transformation functions.
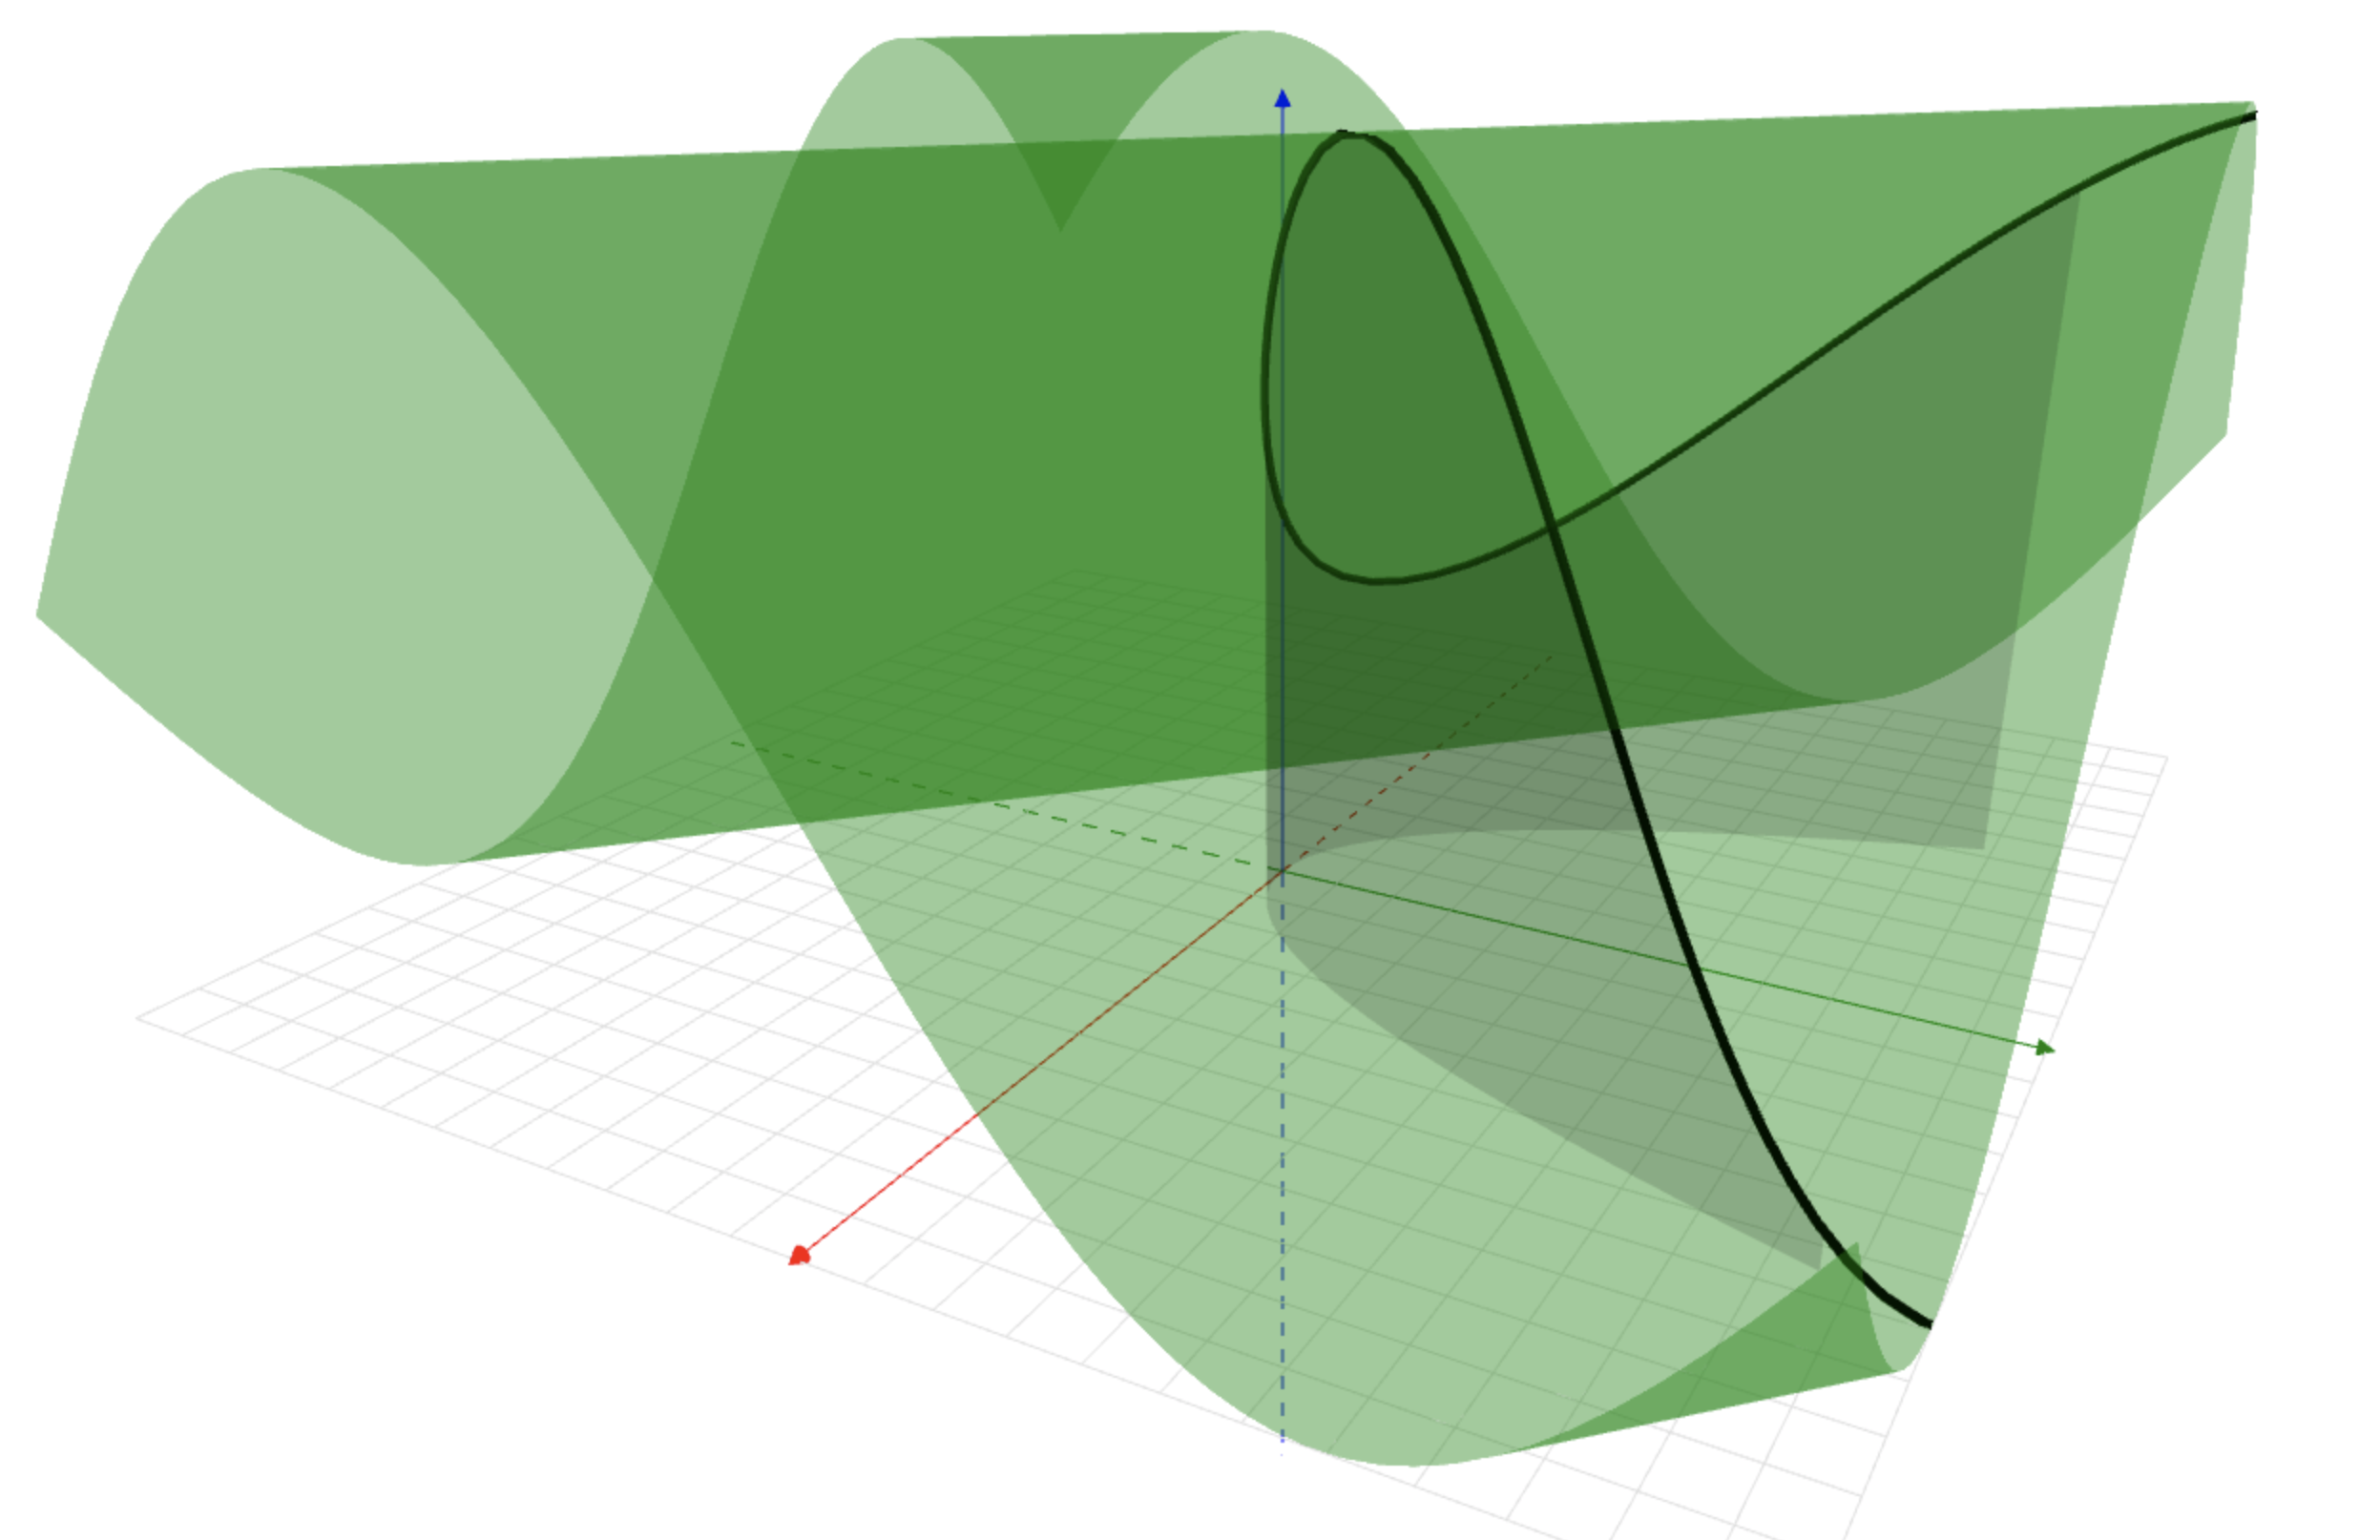
Path Integration
Demonstrates the integral of a surface subject to a path within the x-y plane.
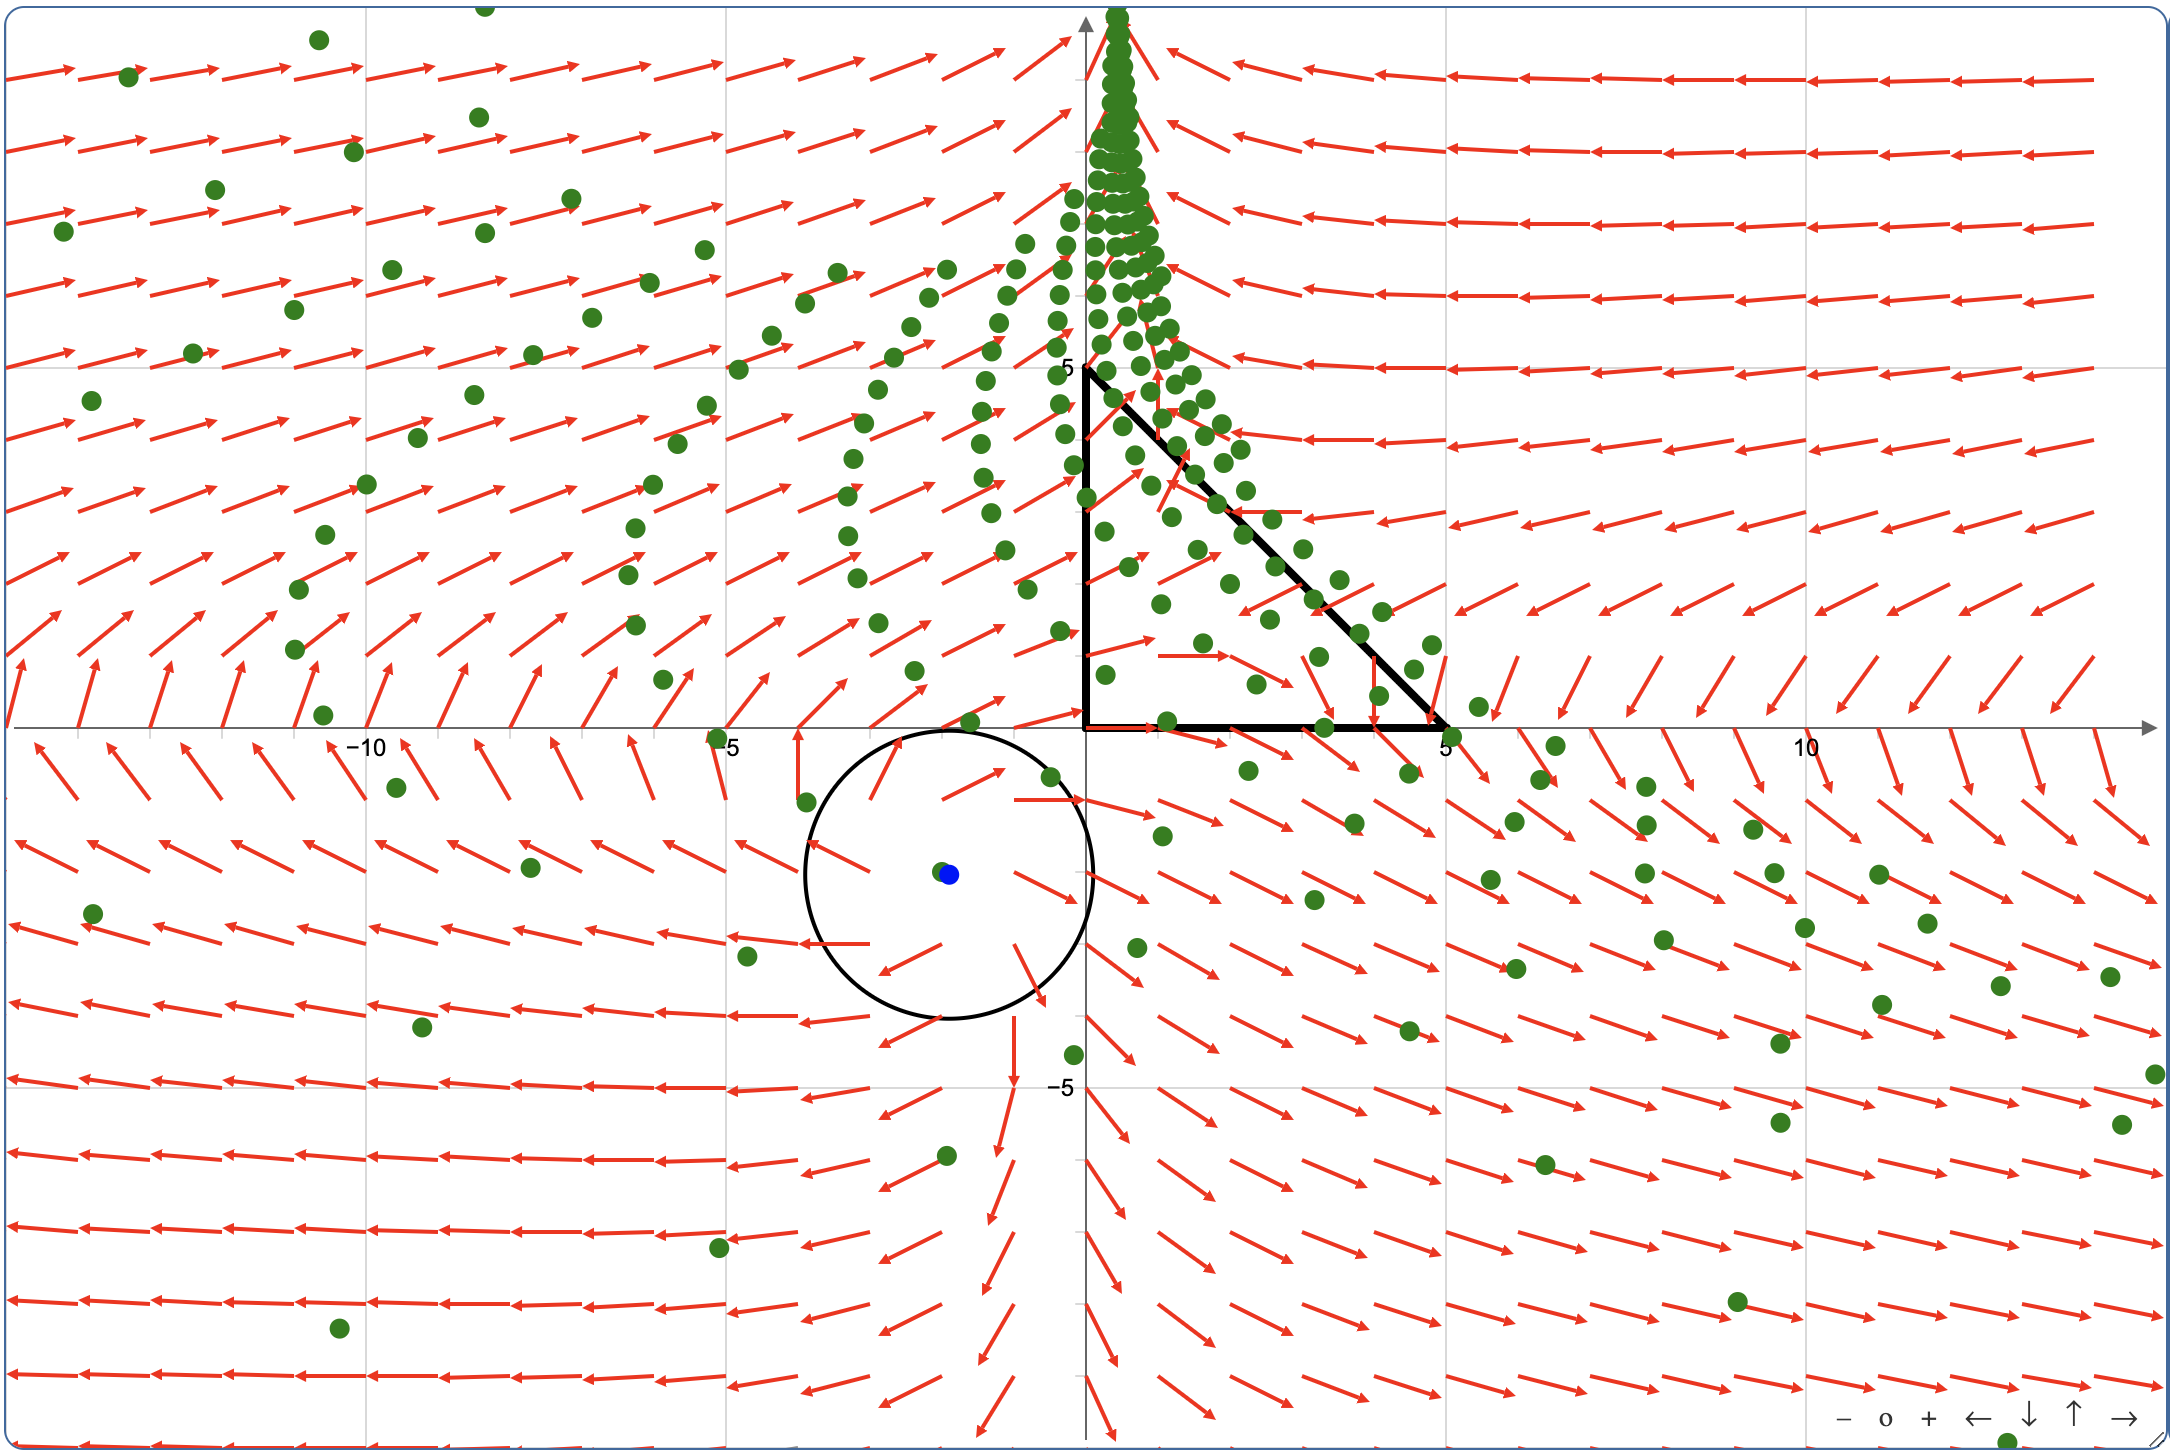
Vector Fields
Graphs 2-dimensional vector fields and allows the user to explore how particles are affected within these systems and see
the value of the curl and divergence for different points on the field.
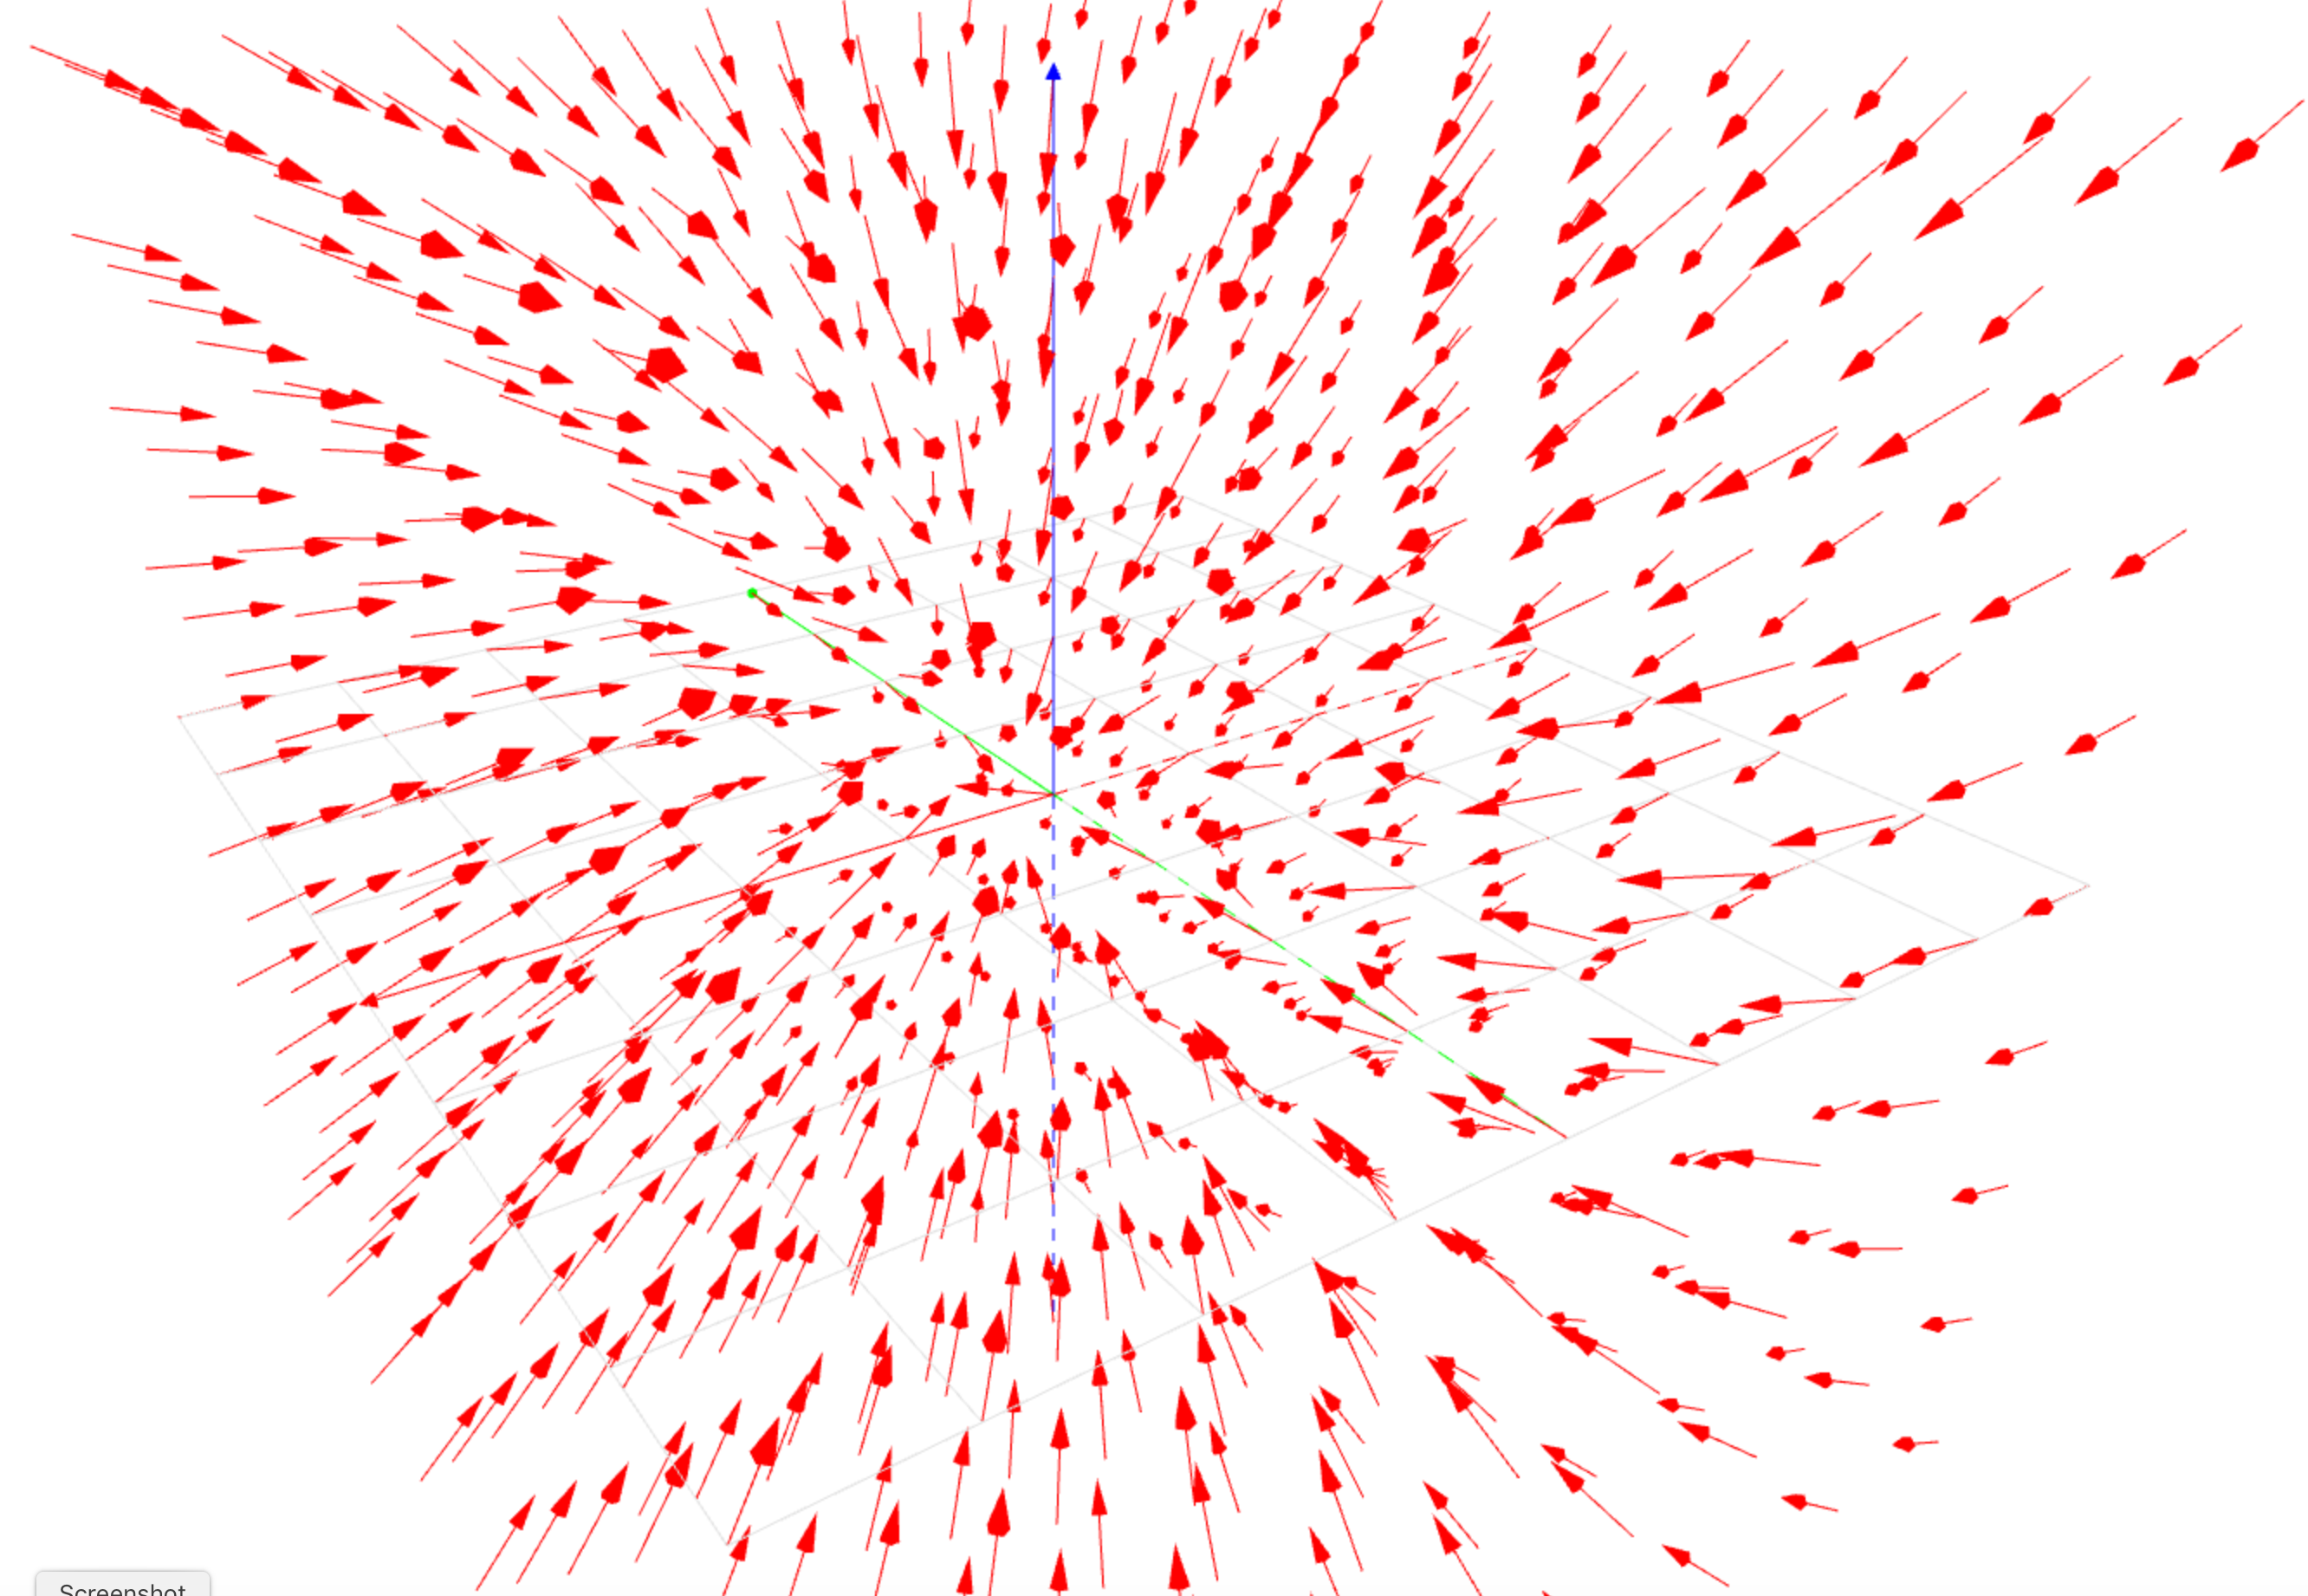
3D Vector Field
Shows a vector field in 3D that you can rotate around.
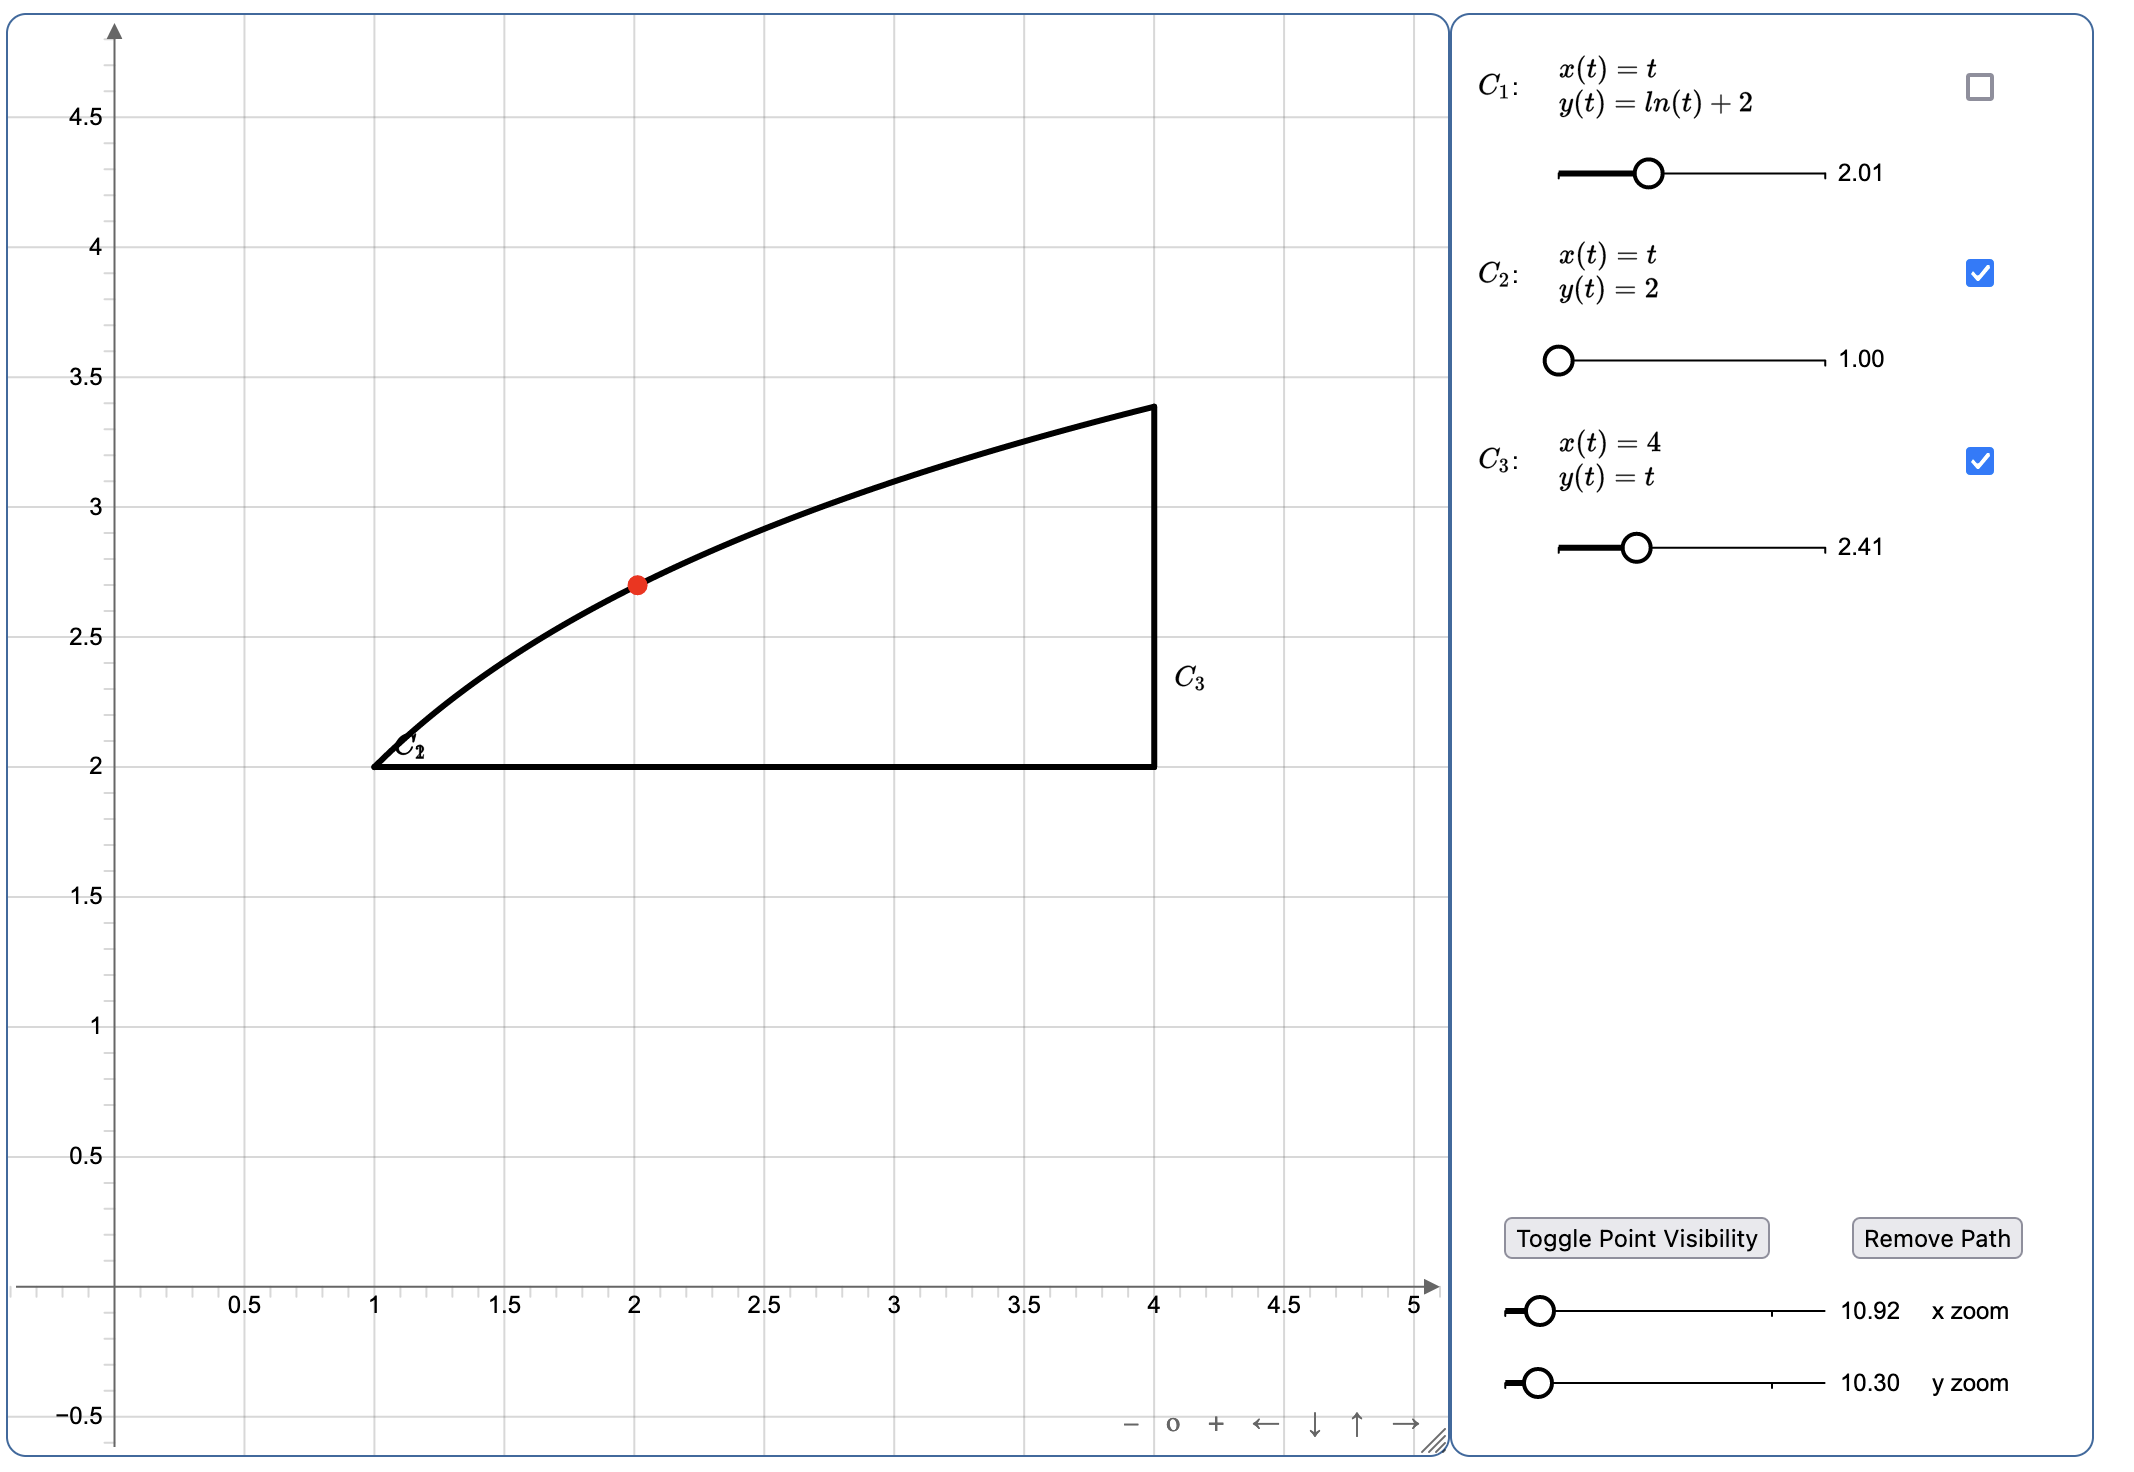
Parameterized Paths
Demonstrates how paths can be constructed in 2D. Helps the student visualize what a parameterized path represents graphically.
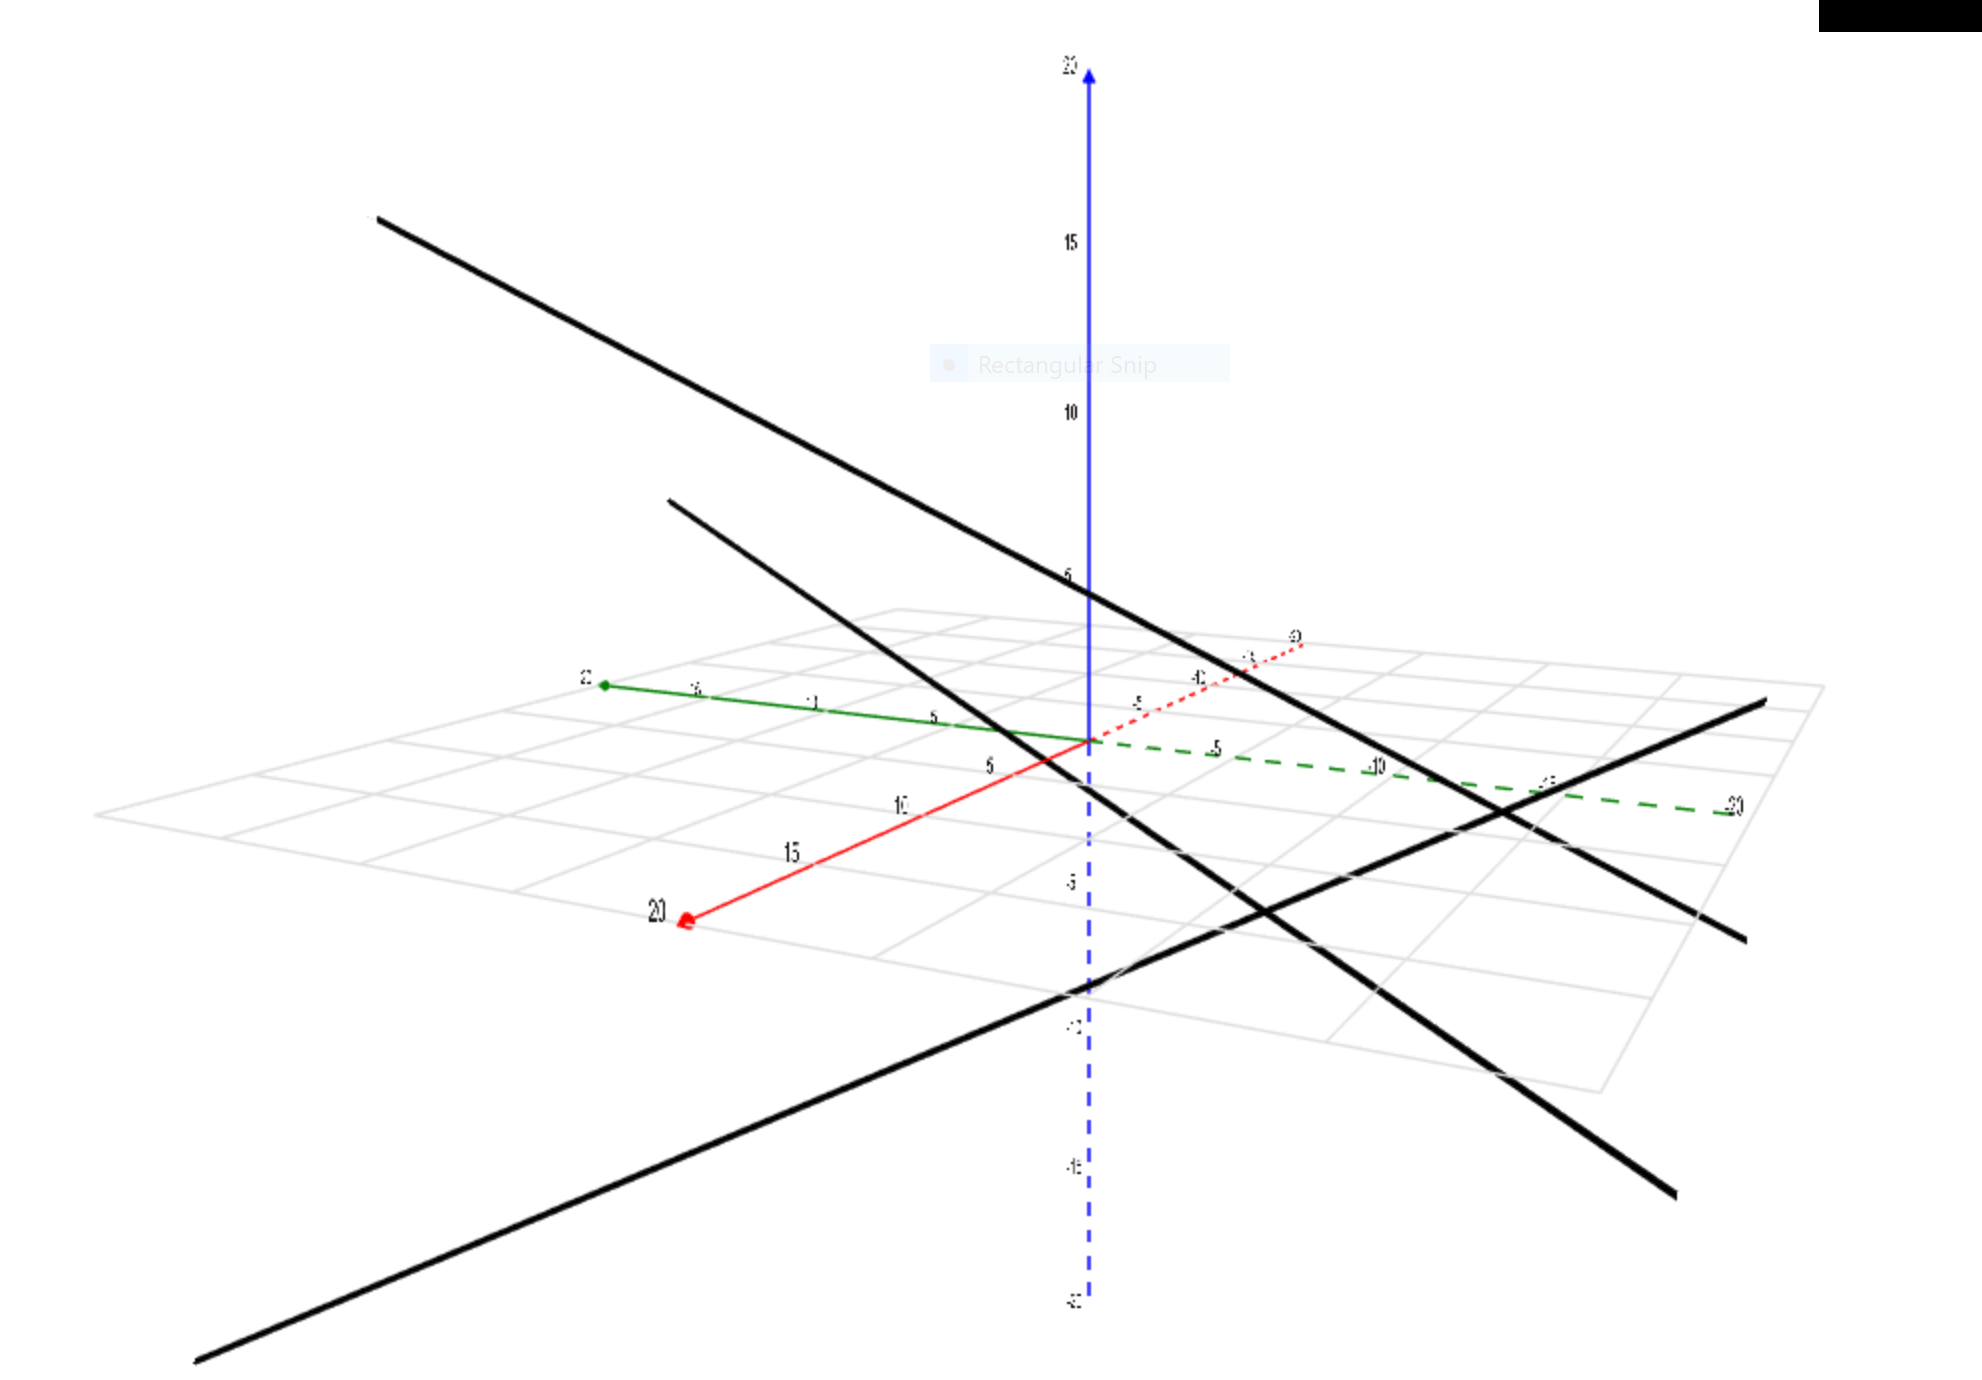
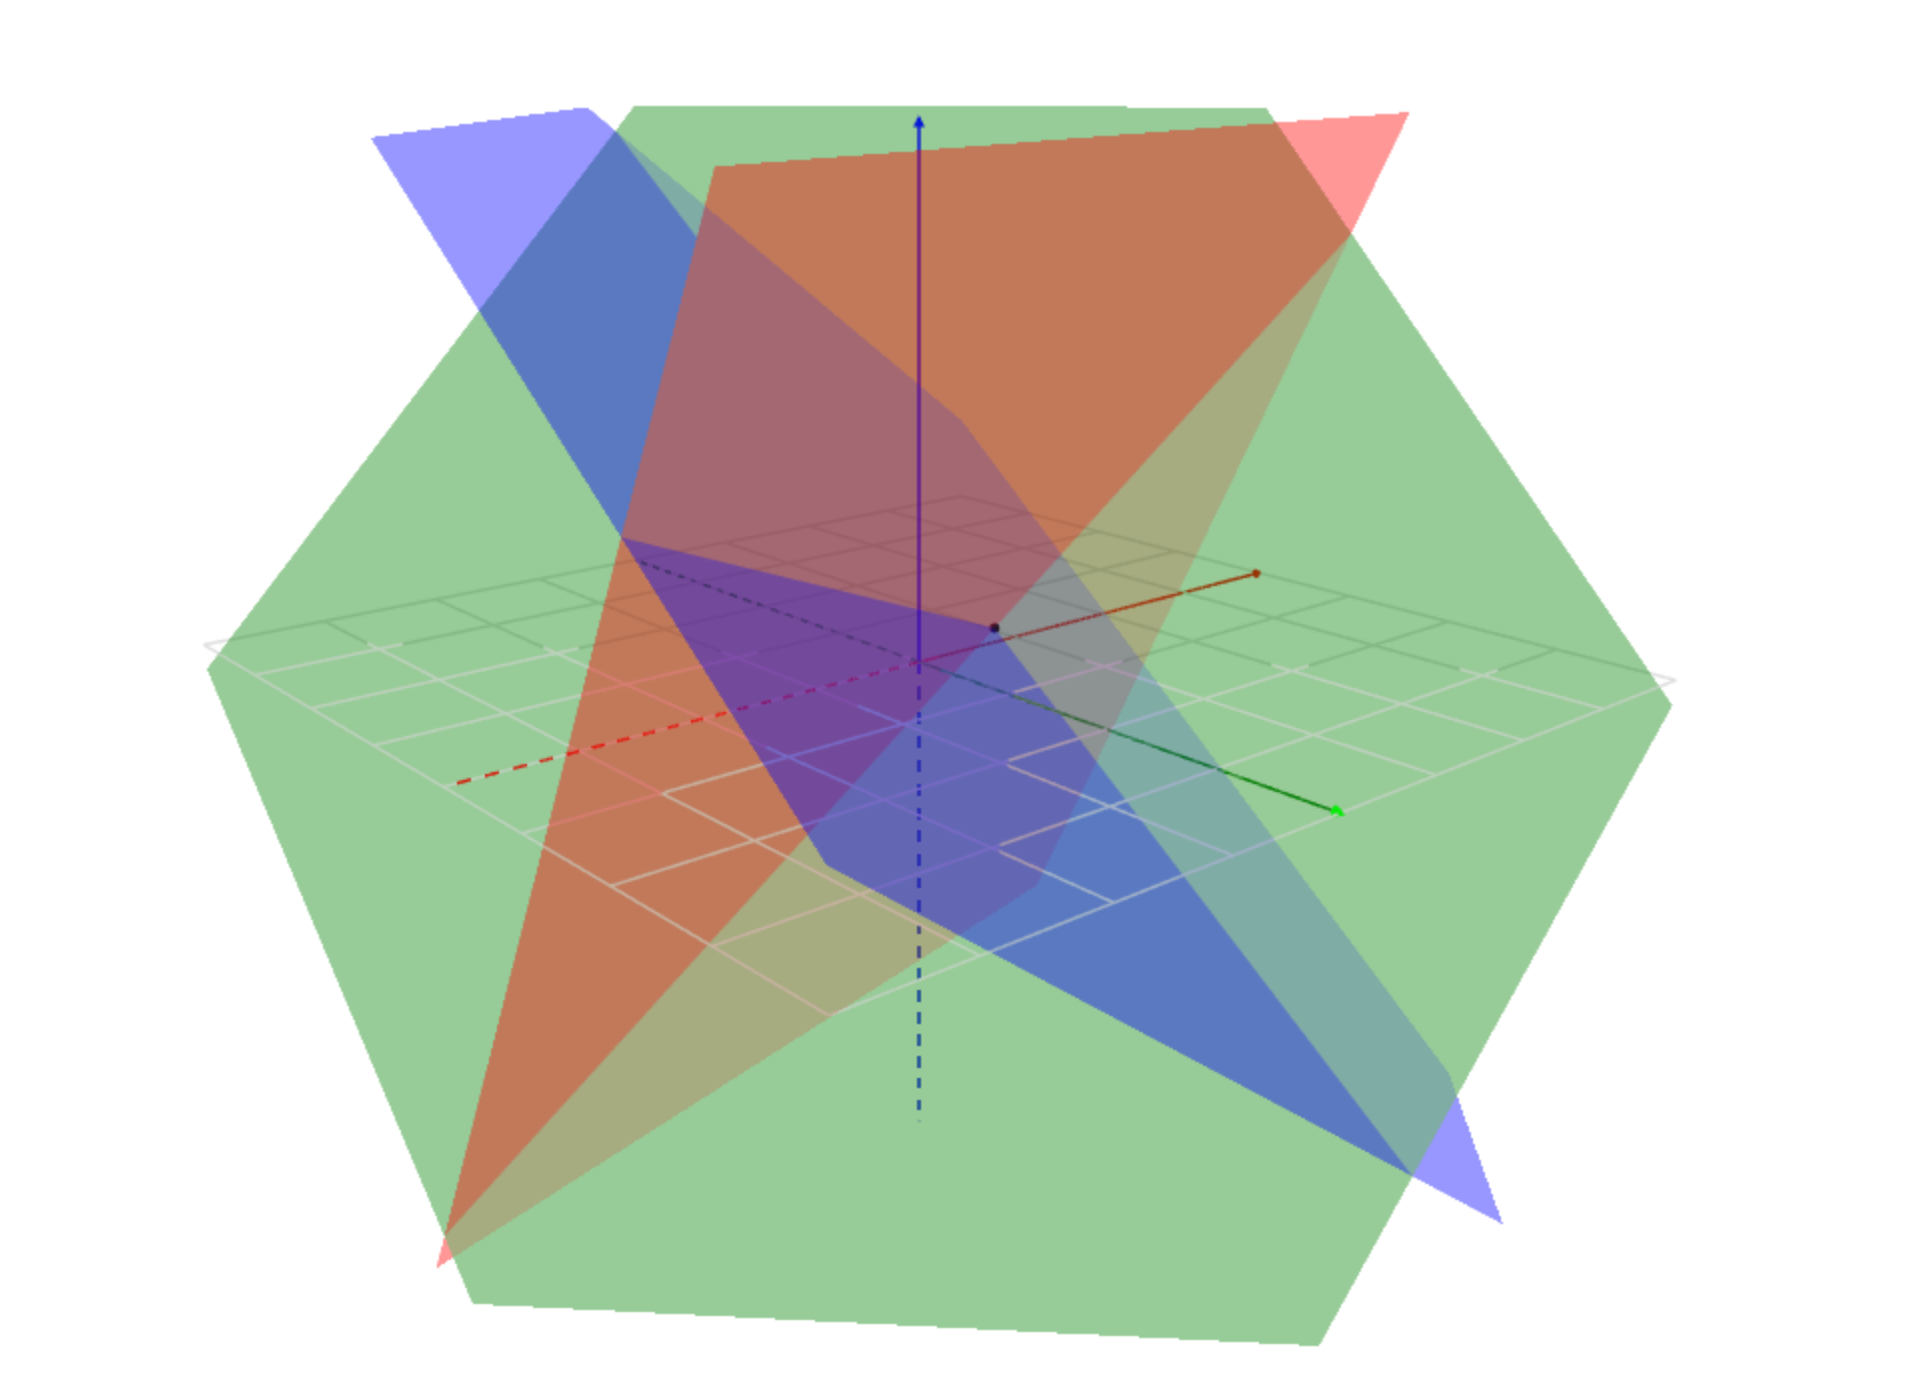
Intersection of Three Planes
Demonstrates what the intersection of three planes at a single point looks like.
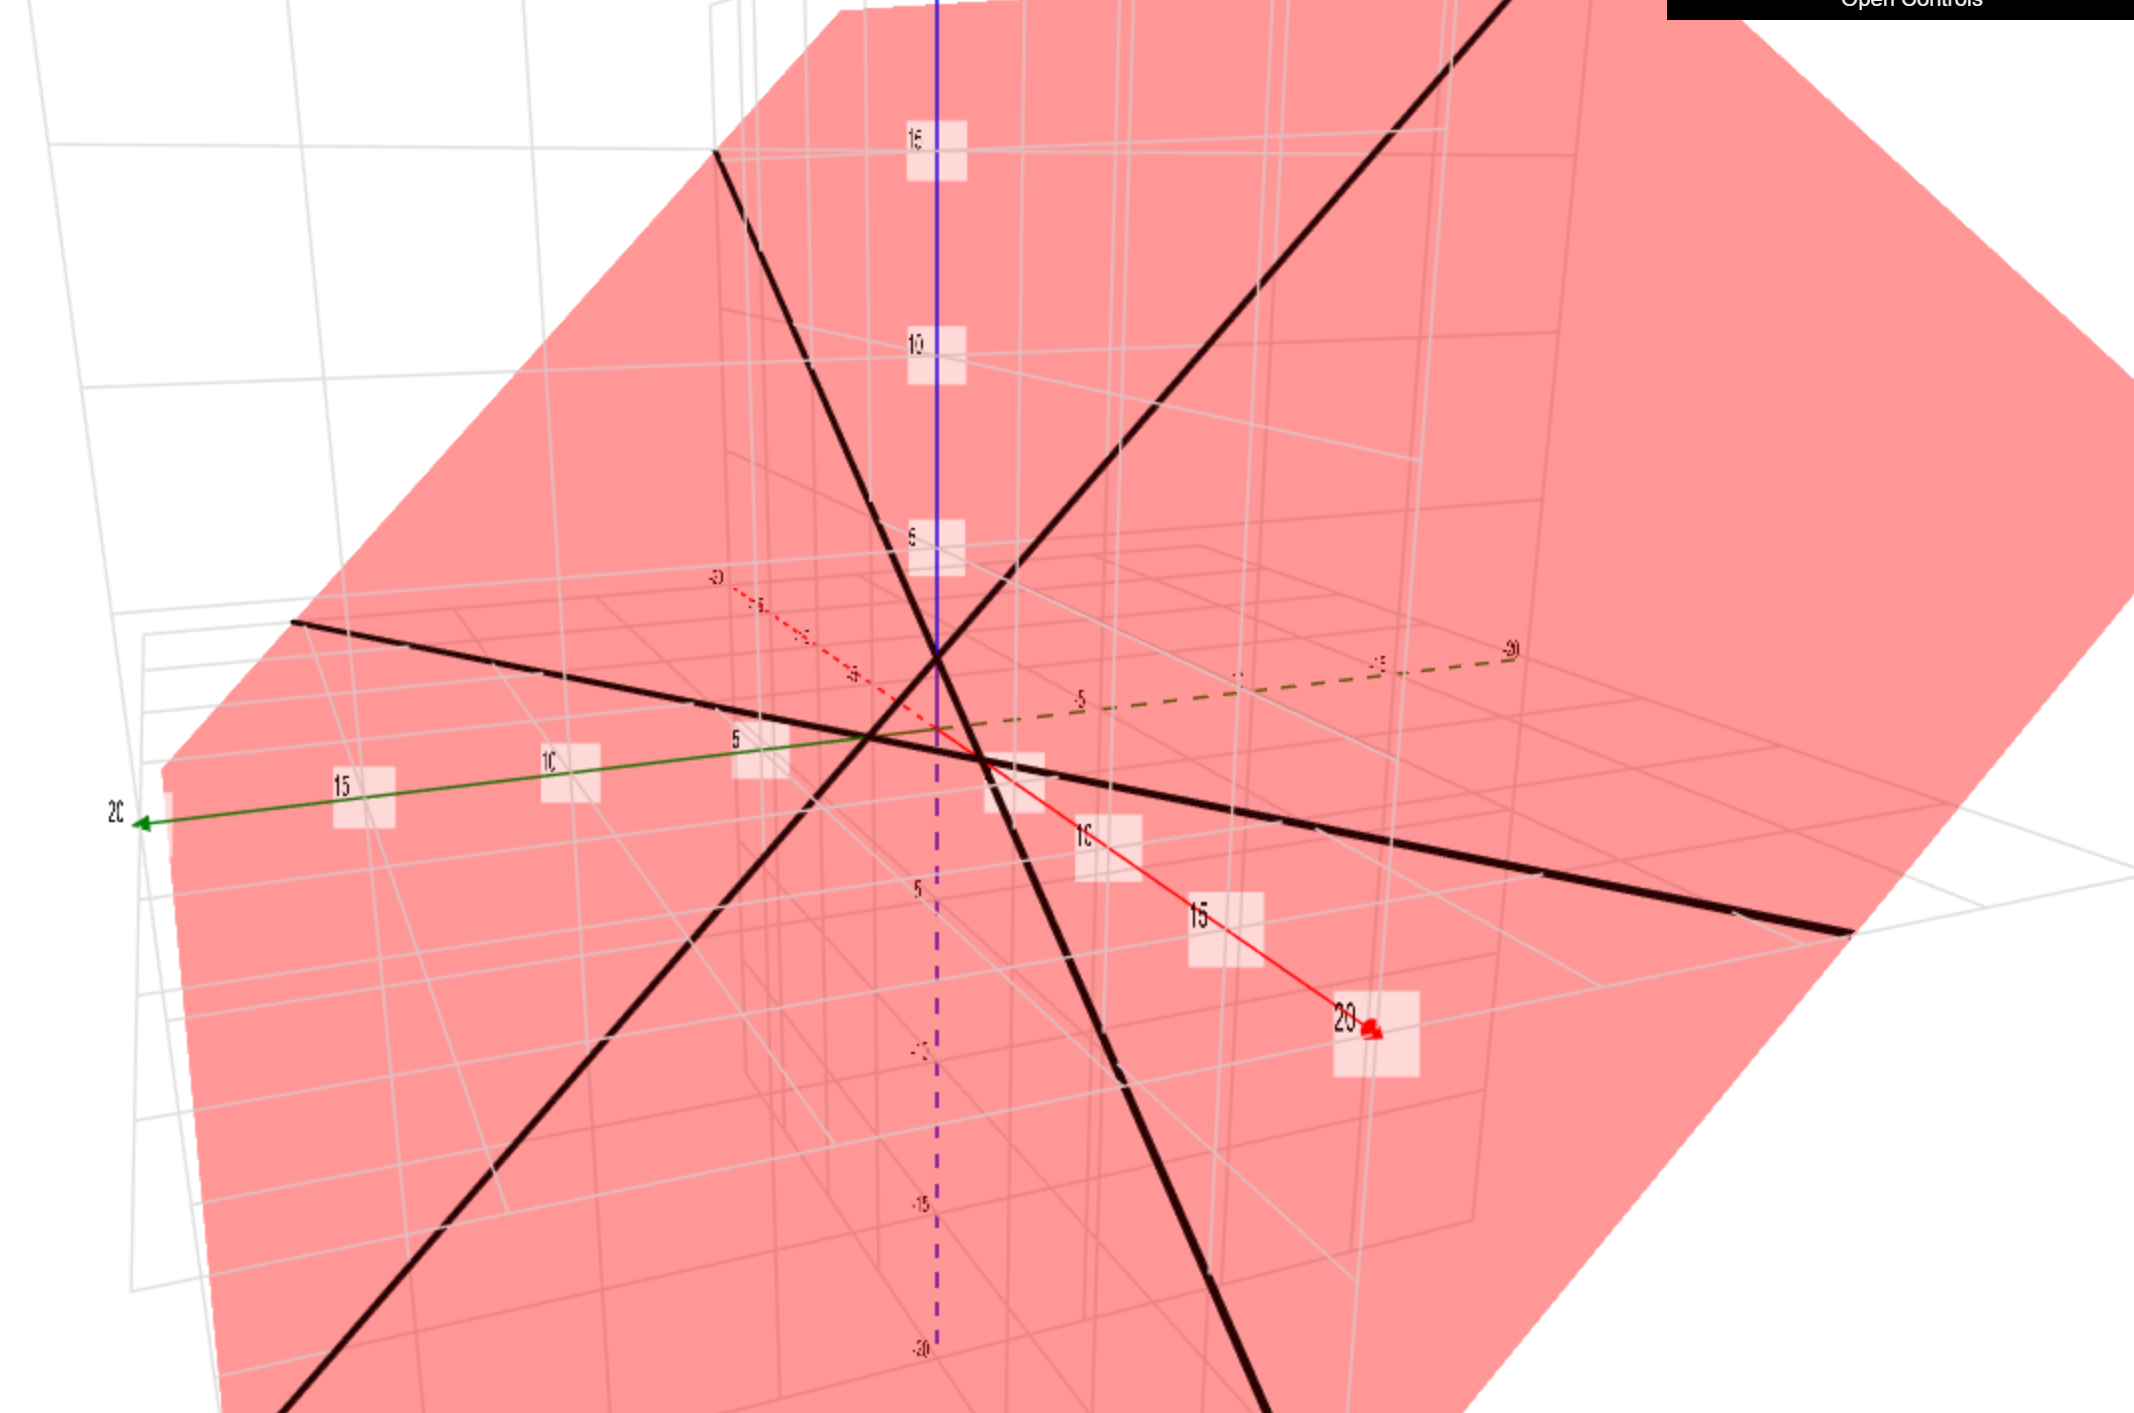
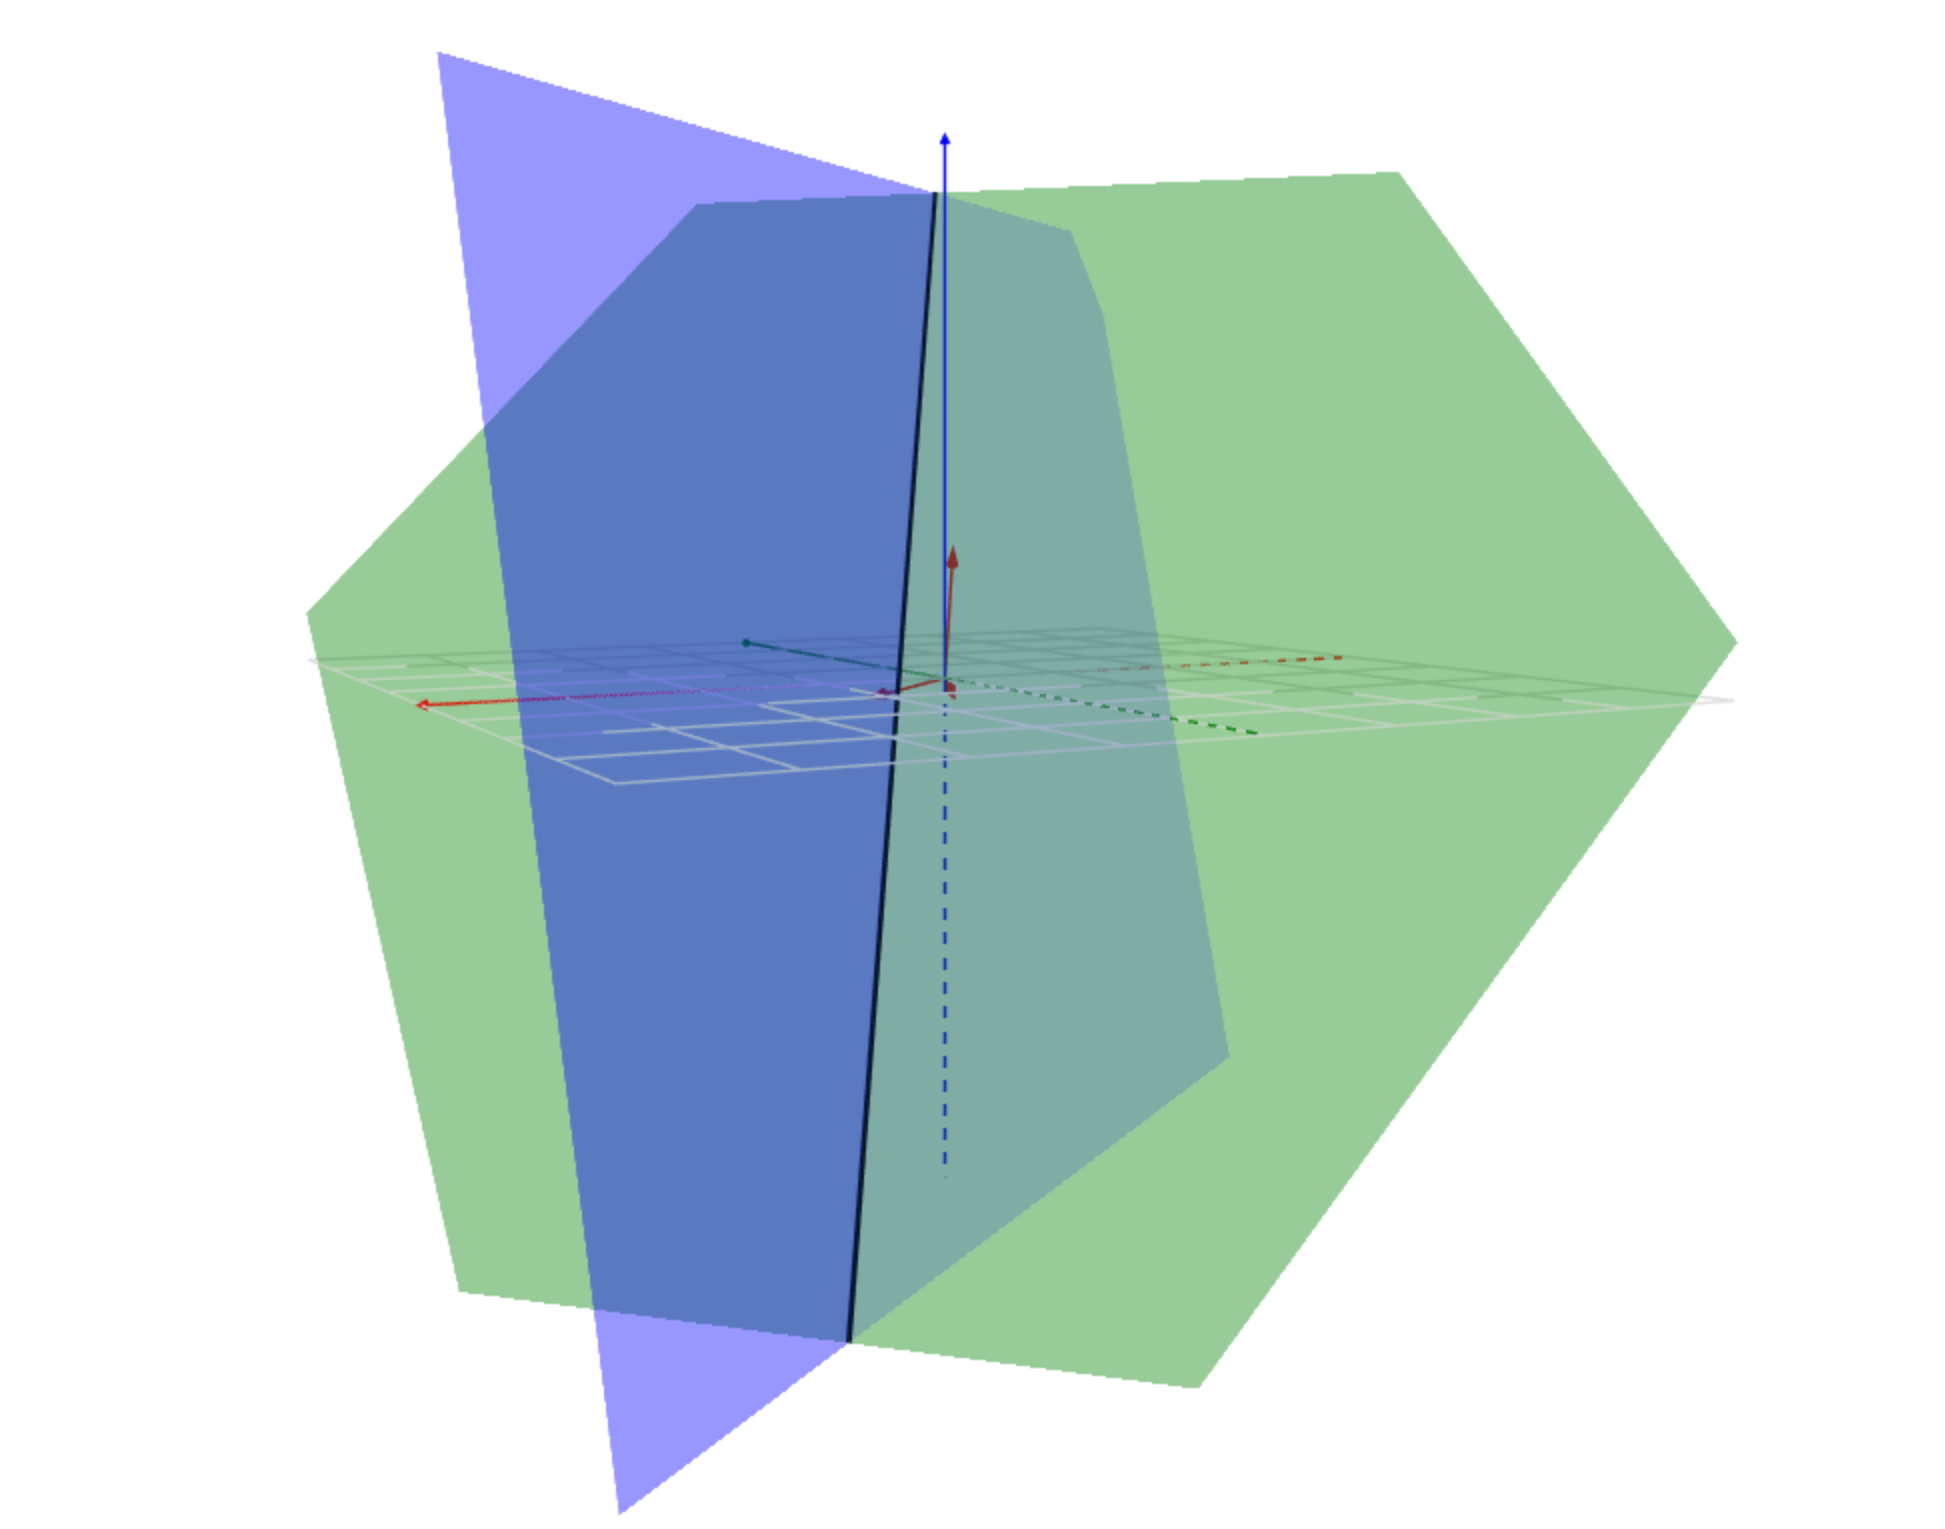
Intersection of Two Planes
Demonstrates what the intersection of two planes in space looks like.