Statistics Applets
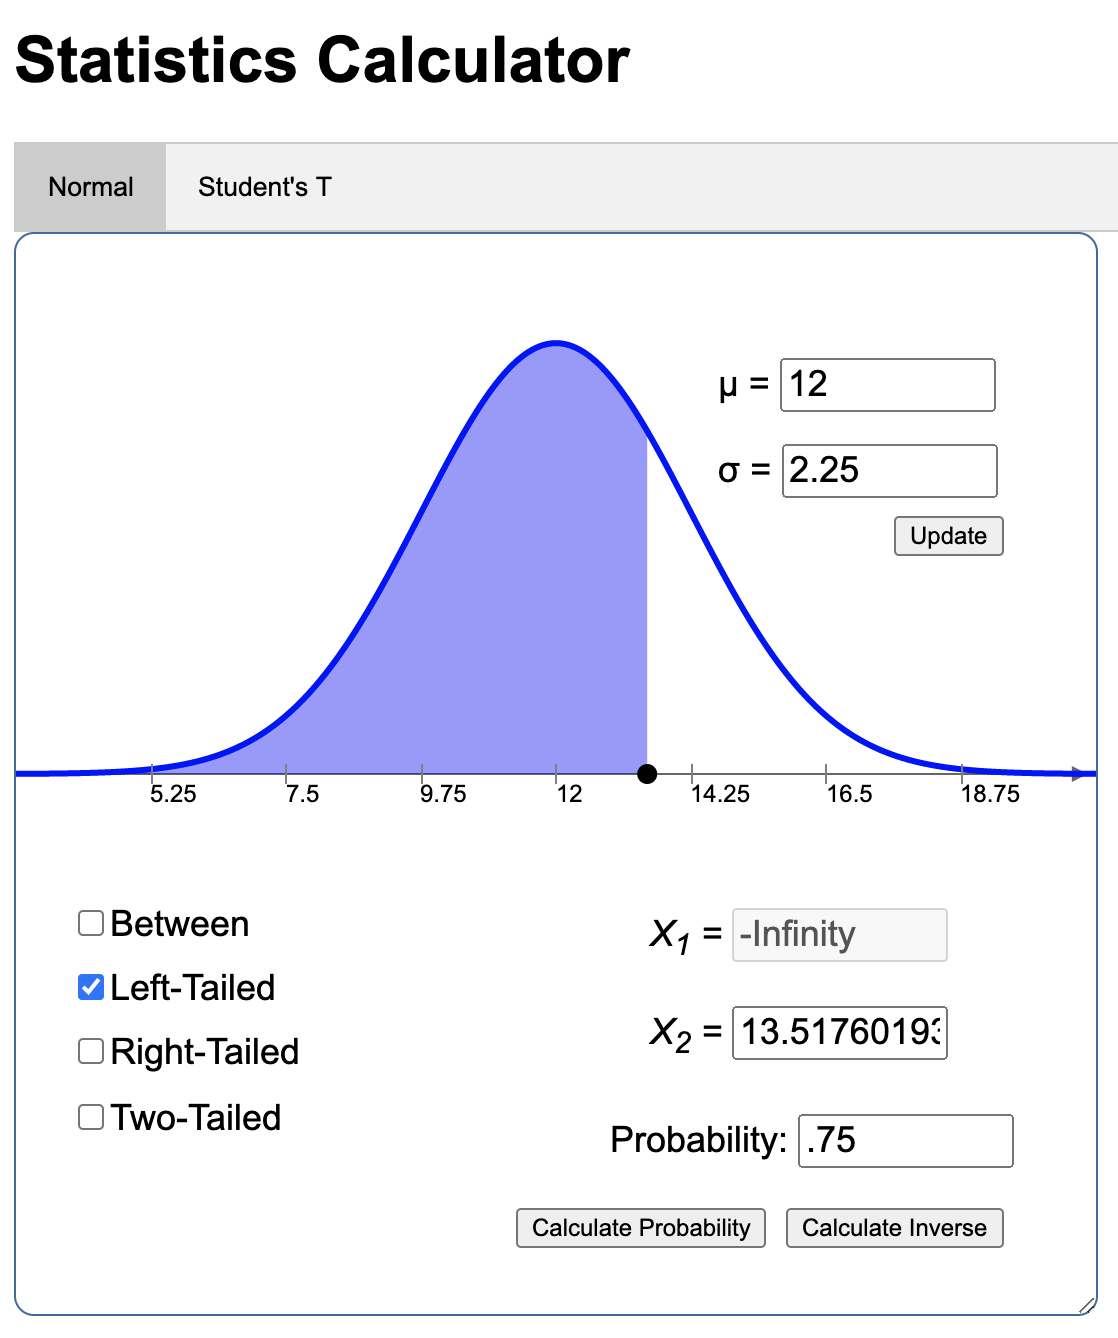
Stats Calculator
Fully operational online statistics calculator that students can use in lieu of a handheld calculator. Performs all operations required of a introductory-level statistics class. Great option for online classes.
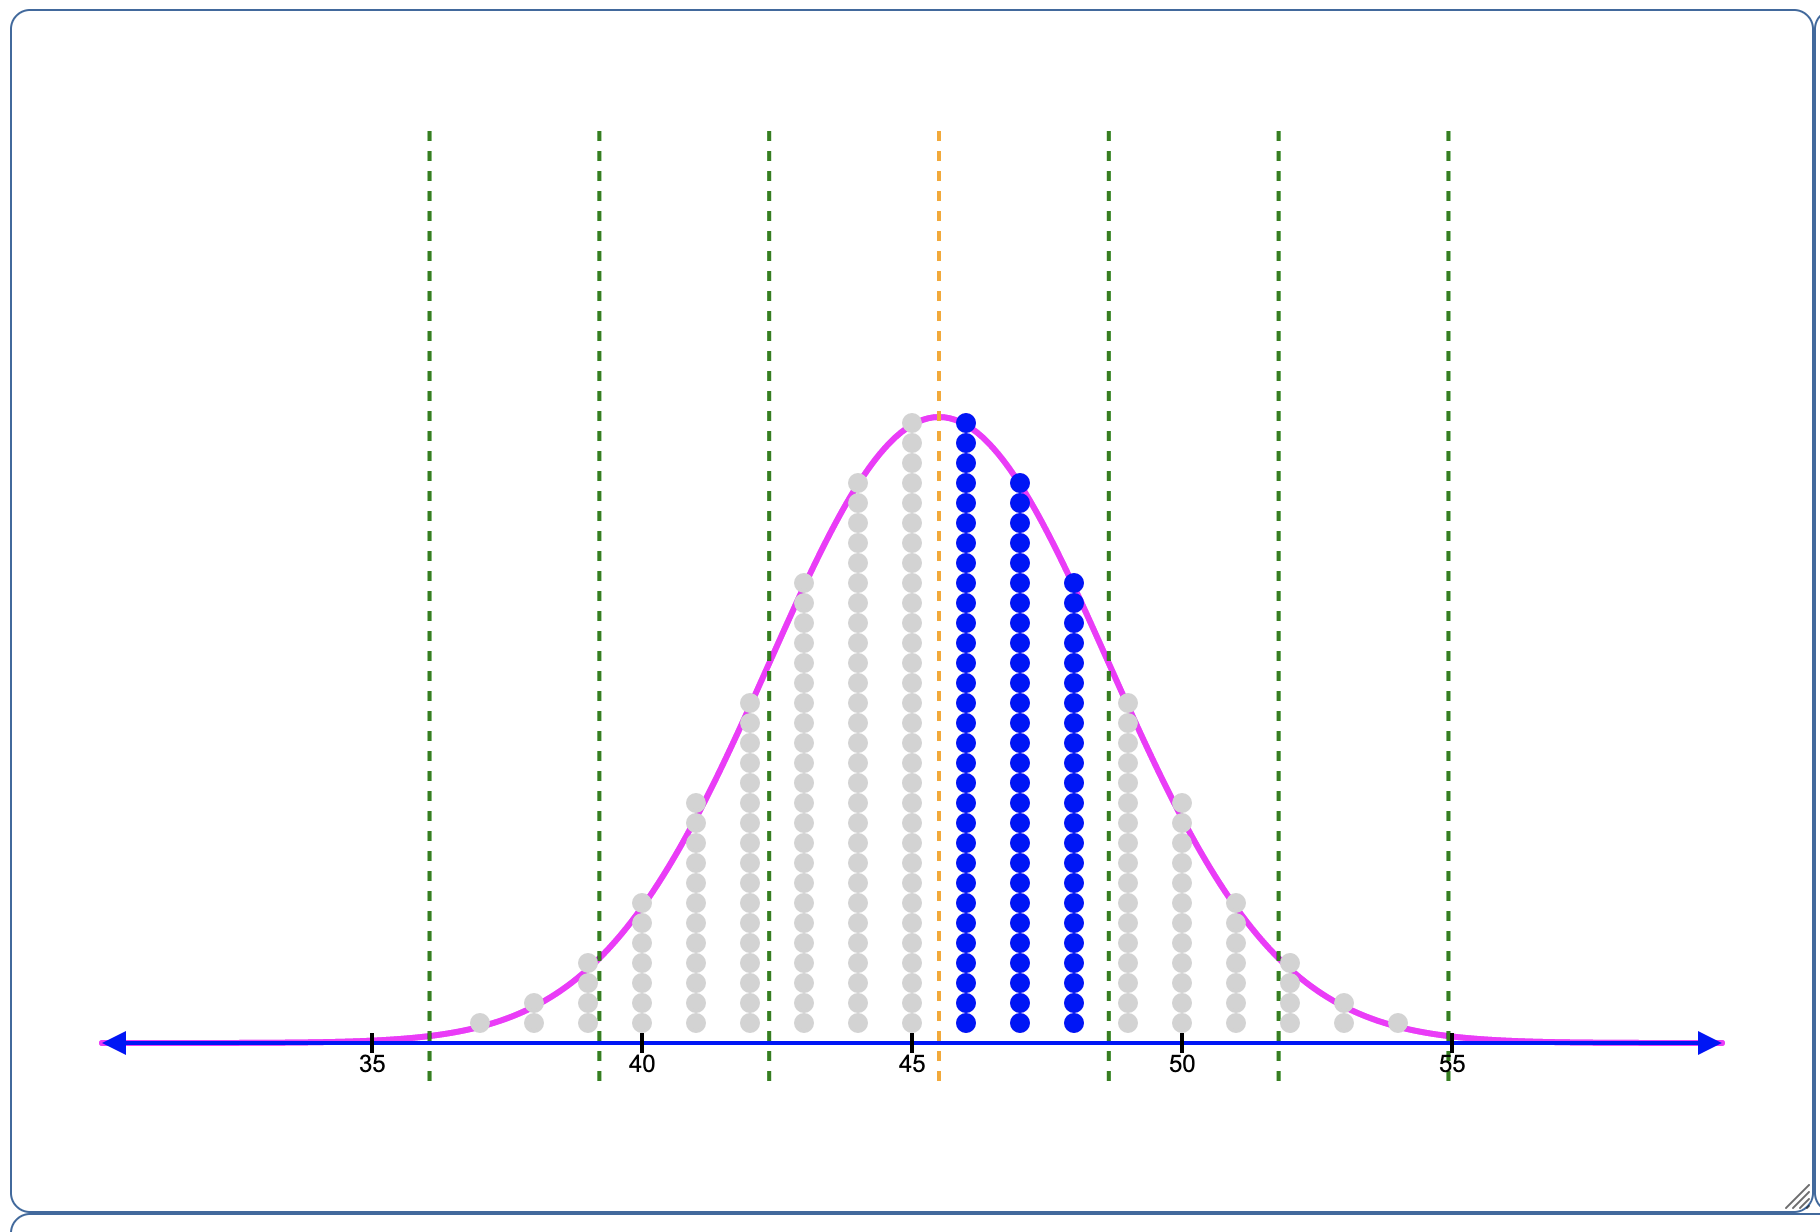
Empirical Rule
Demonstrates how the empirical rule works by highlighting points within a dot plot that is normally distributed.
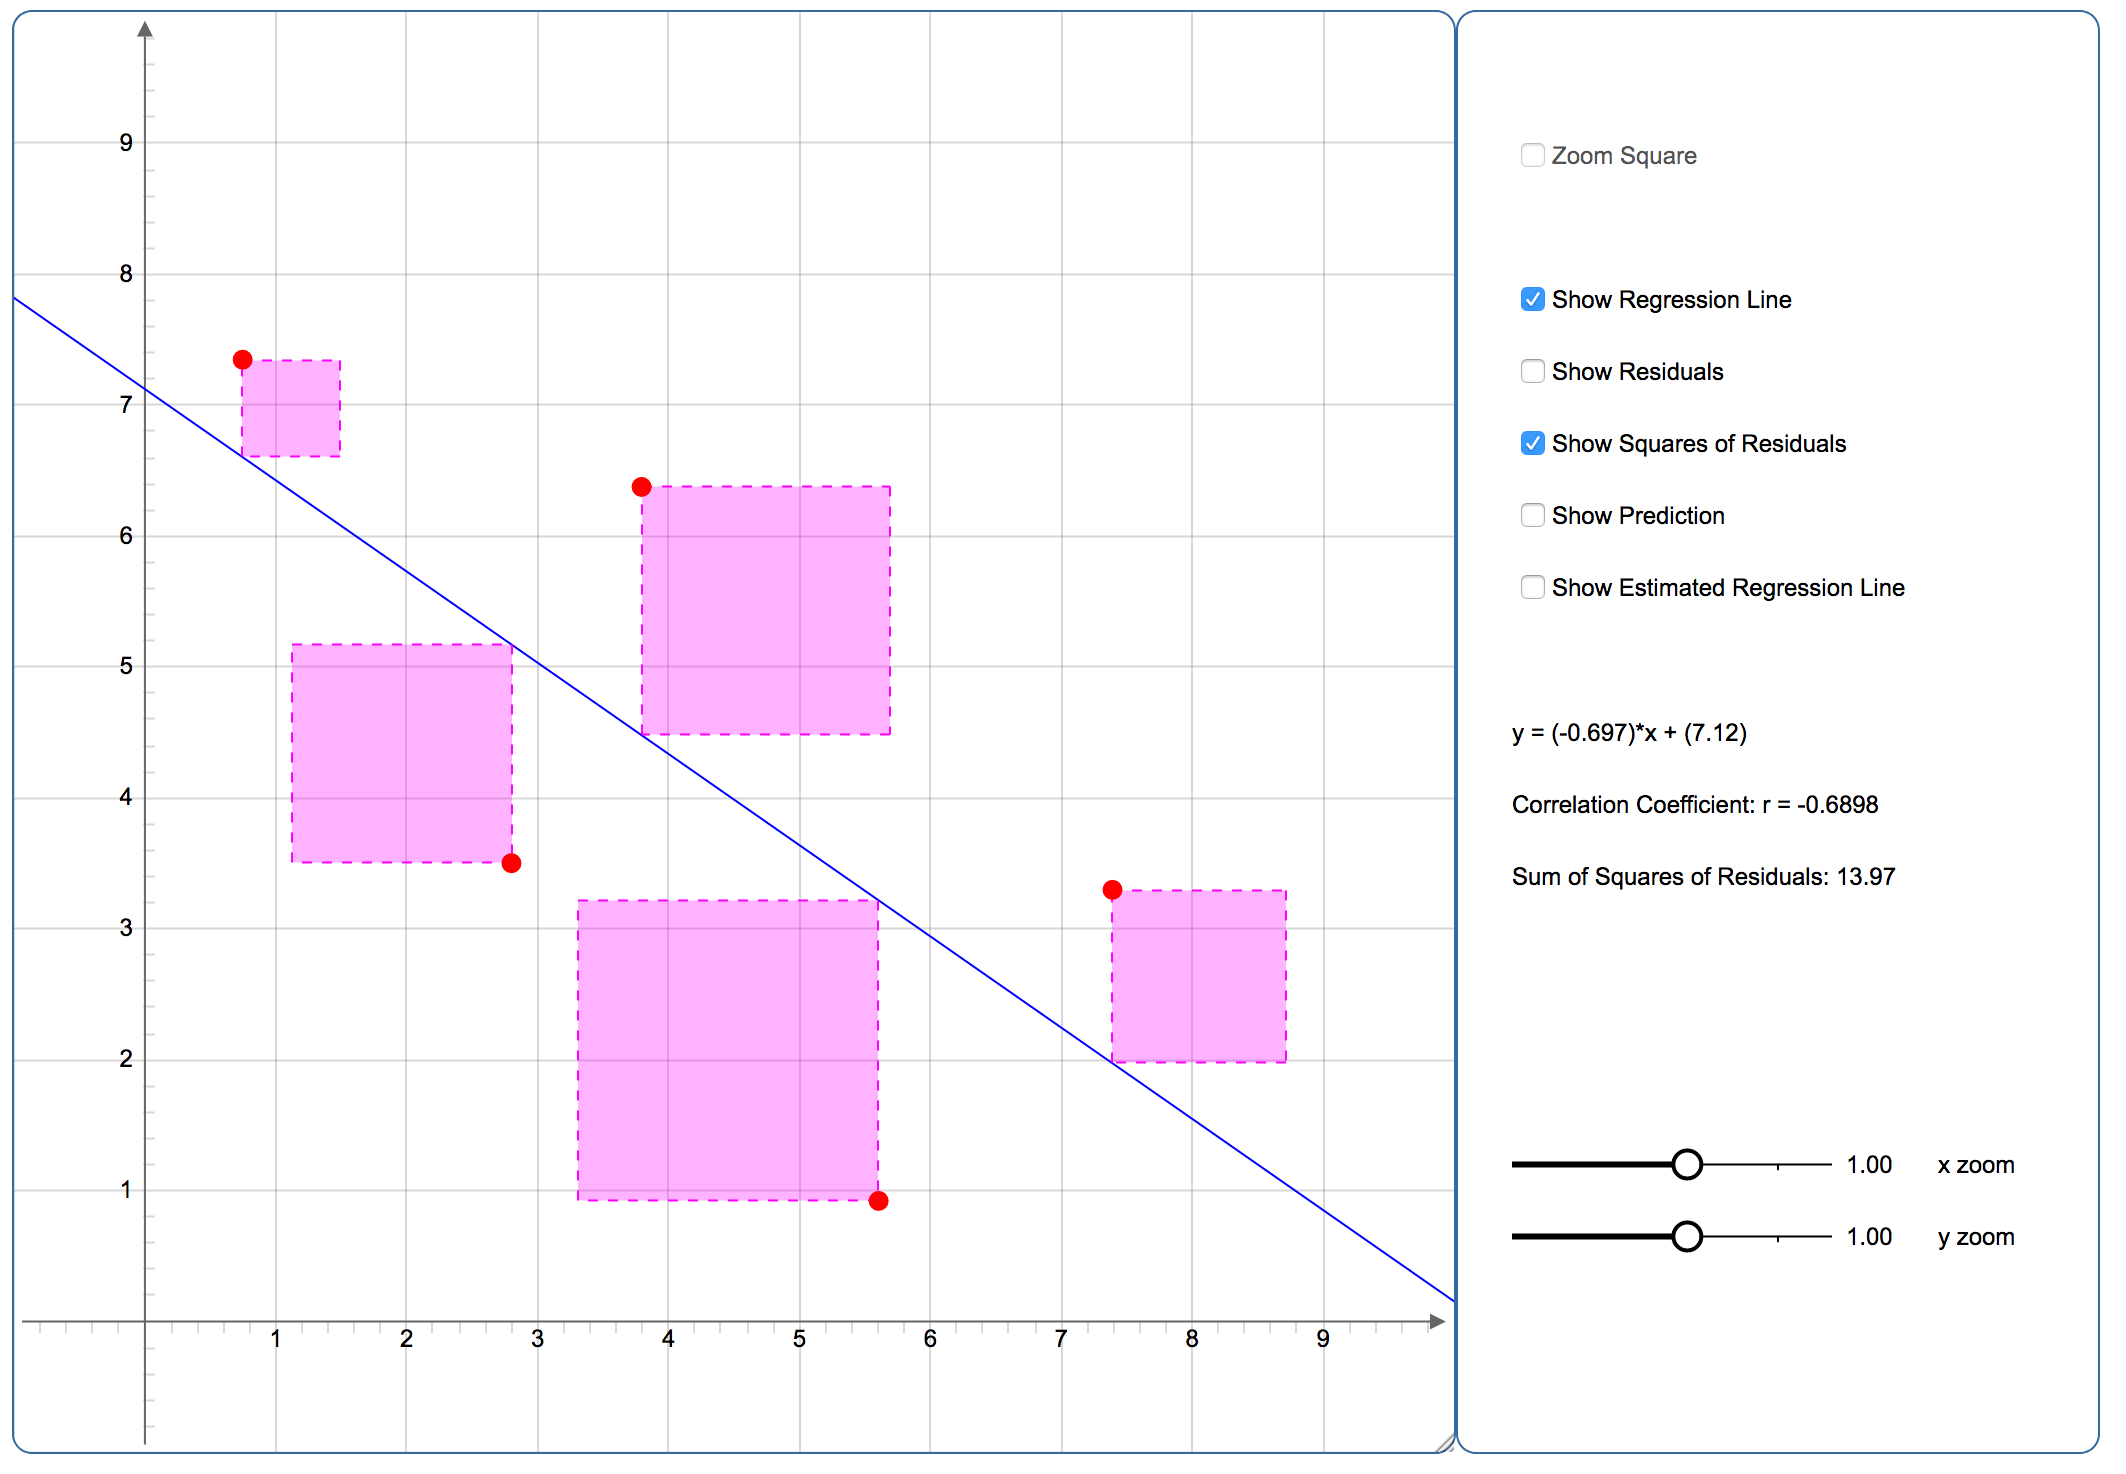
Linear Regression
Demonstrates how the points on a plane and the line of best fit interact. Can display the residuals or the squares of the
residuals for the data set and regression line. The user can move a point along the x-axis and make a prediction on the y-axis. Also allows the user to predict
the location of a regression line in order to see how the line is computed by minimizing the sum of the squares of the residuals.
Binomial Distribution
Allows user to create a binomial distribution graph and pdf/cdf chart based on a given value of n and p.
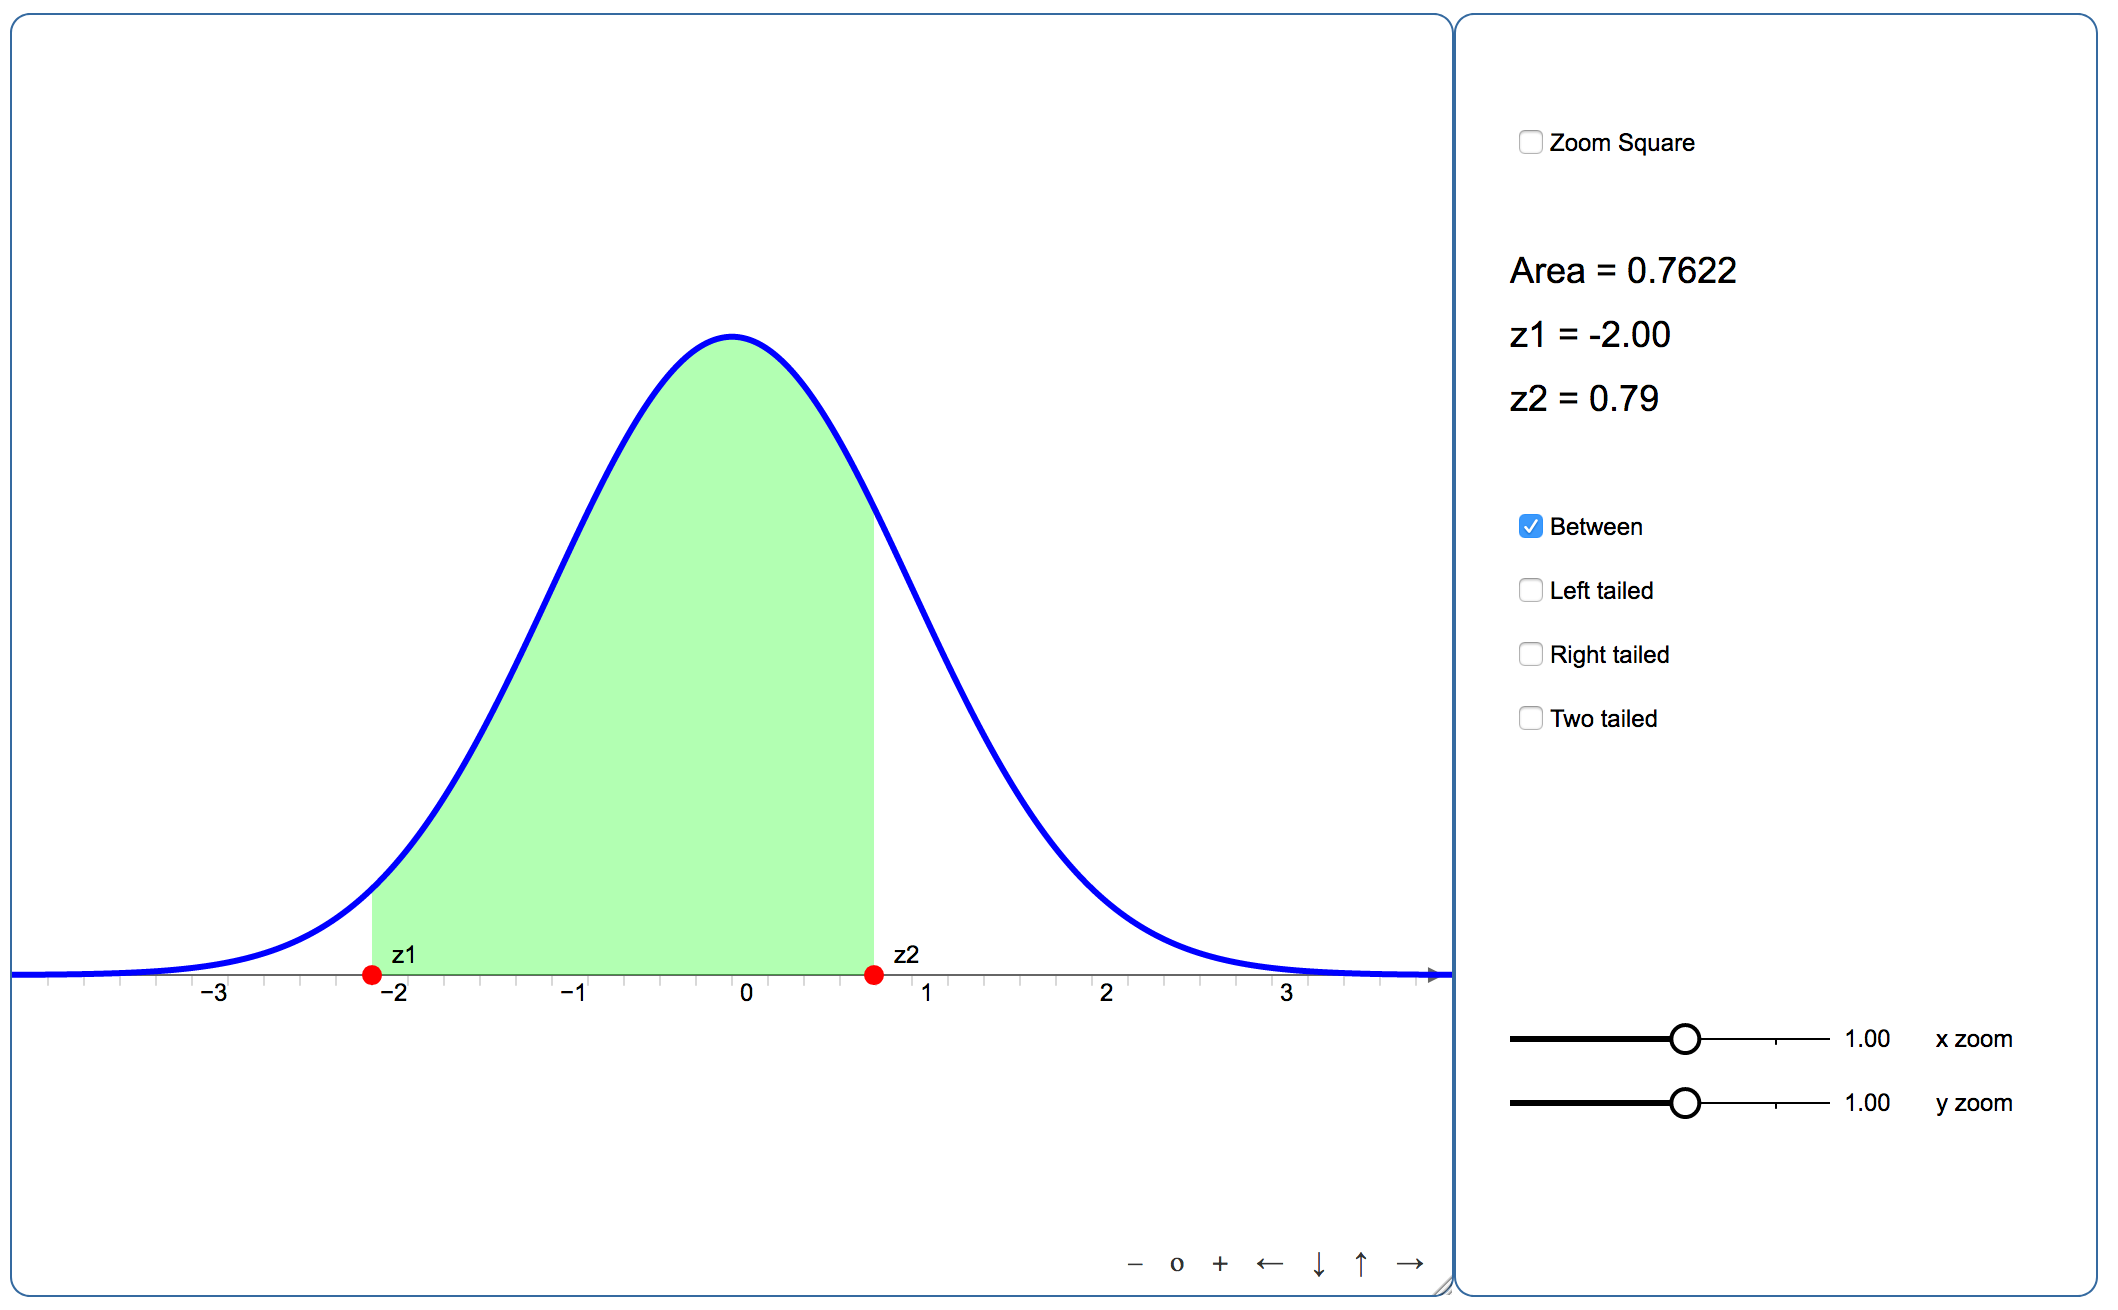
Standard Normal Distribution
Allows user find normal probabilities based on given z-scores.
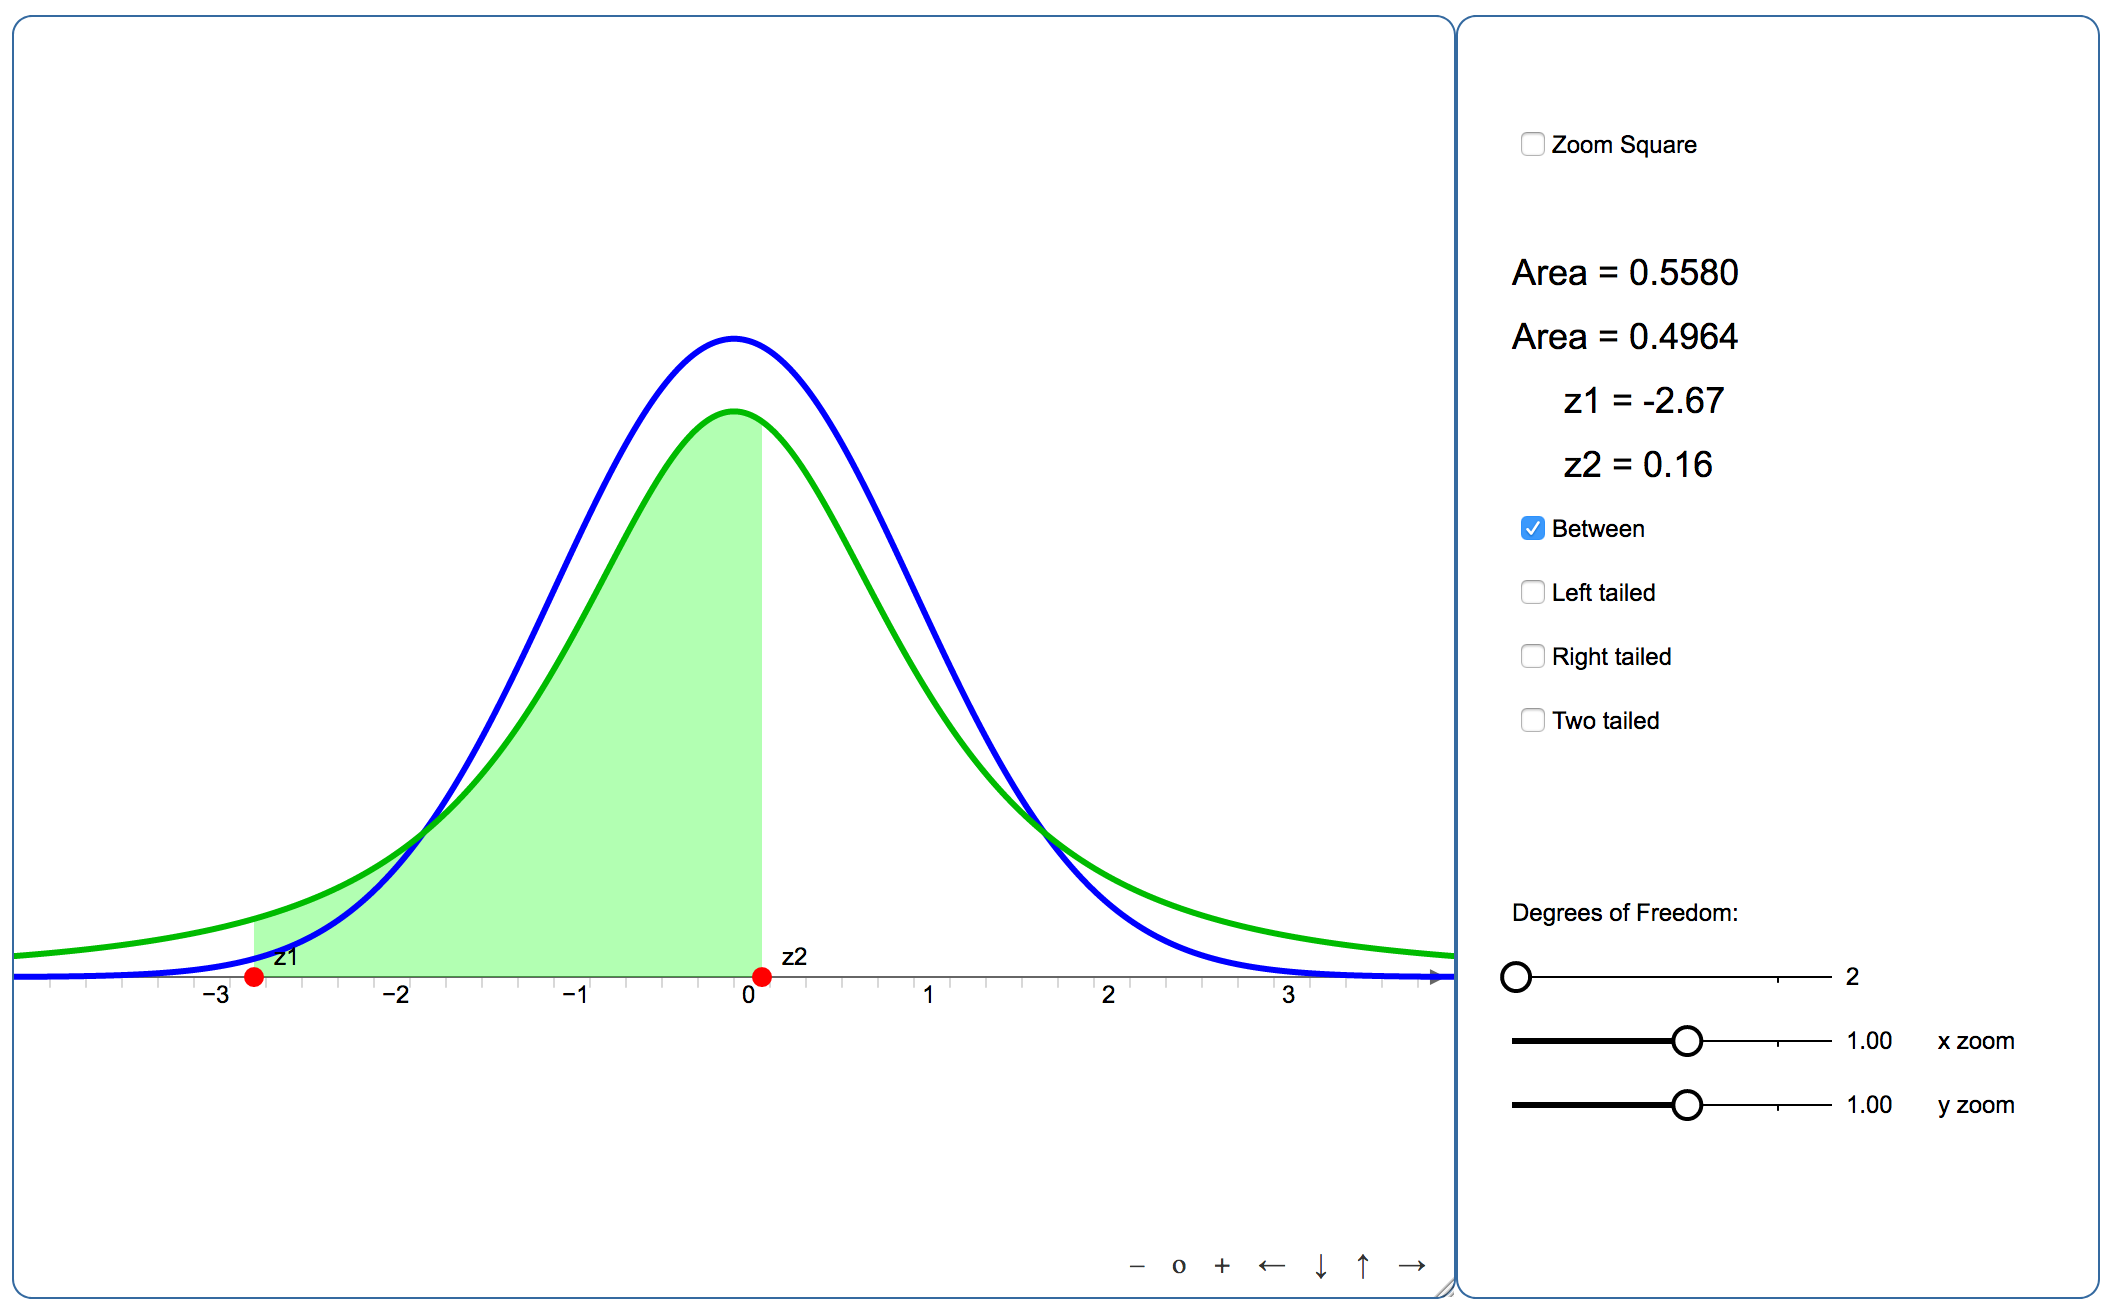
t-Distribution
Allows user to find t-distribution probabilities and compare the results to a normal distribution.
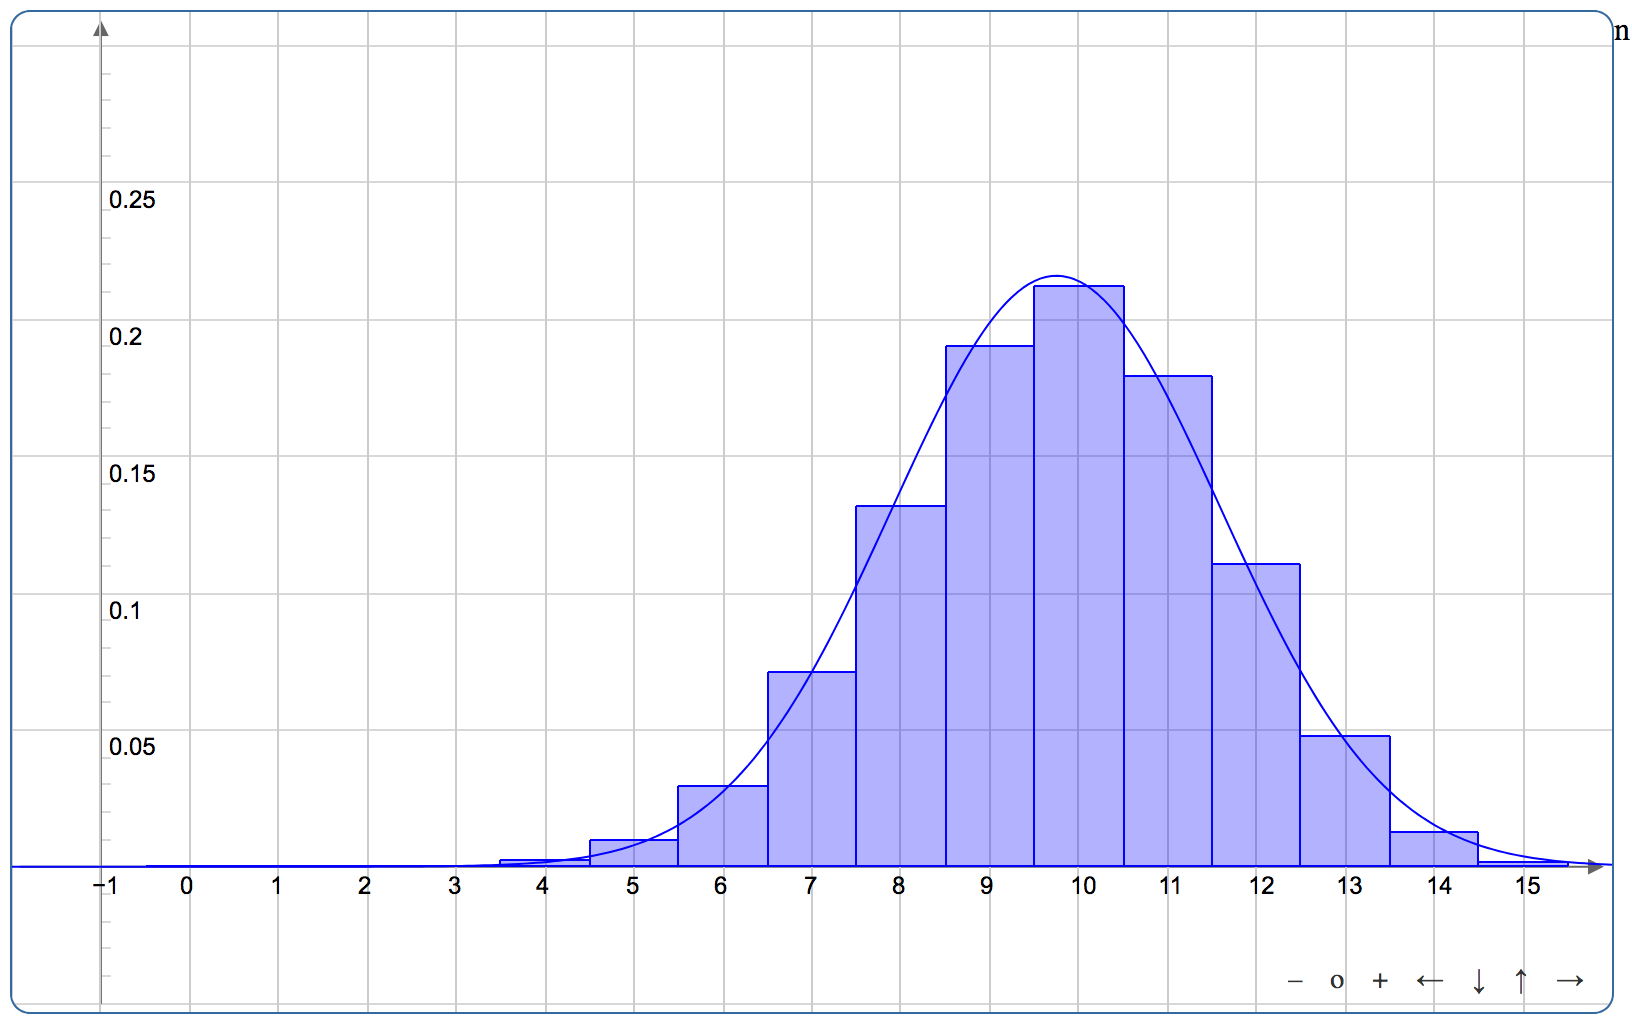
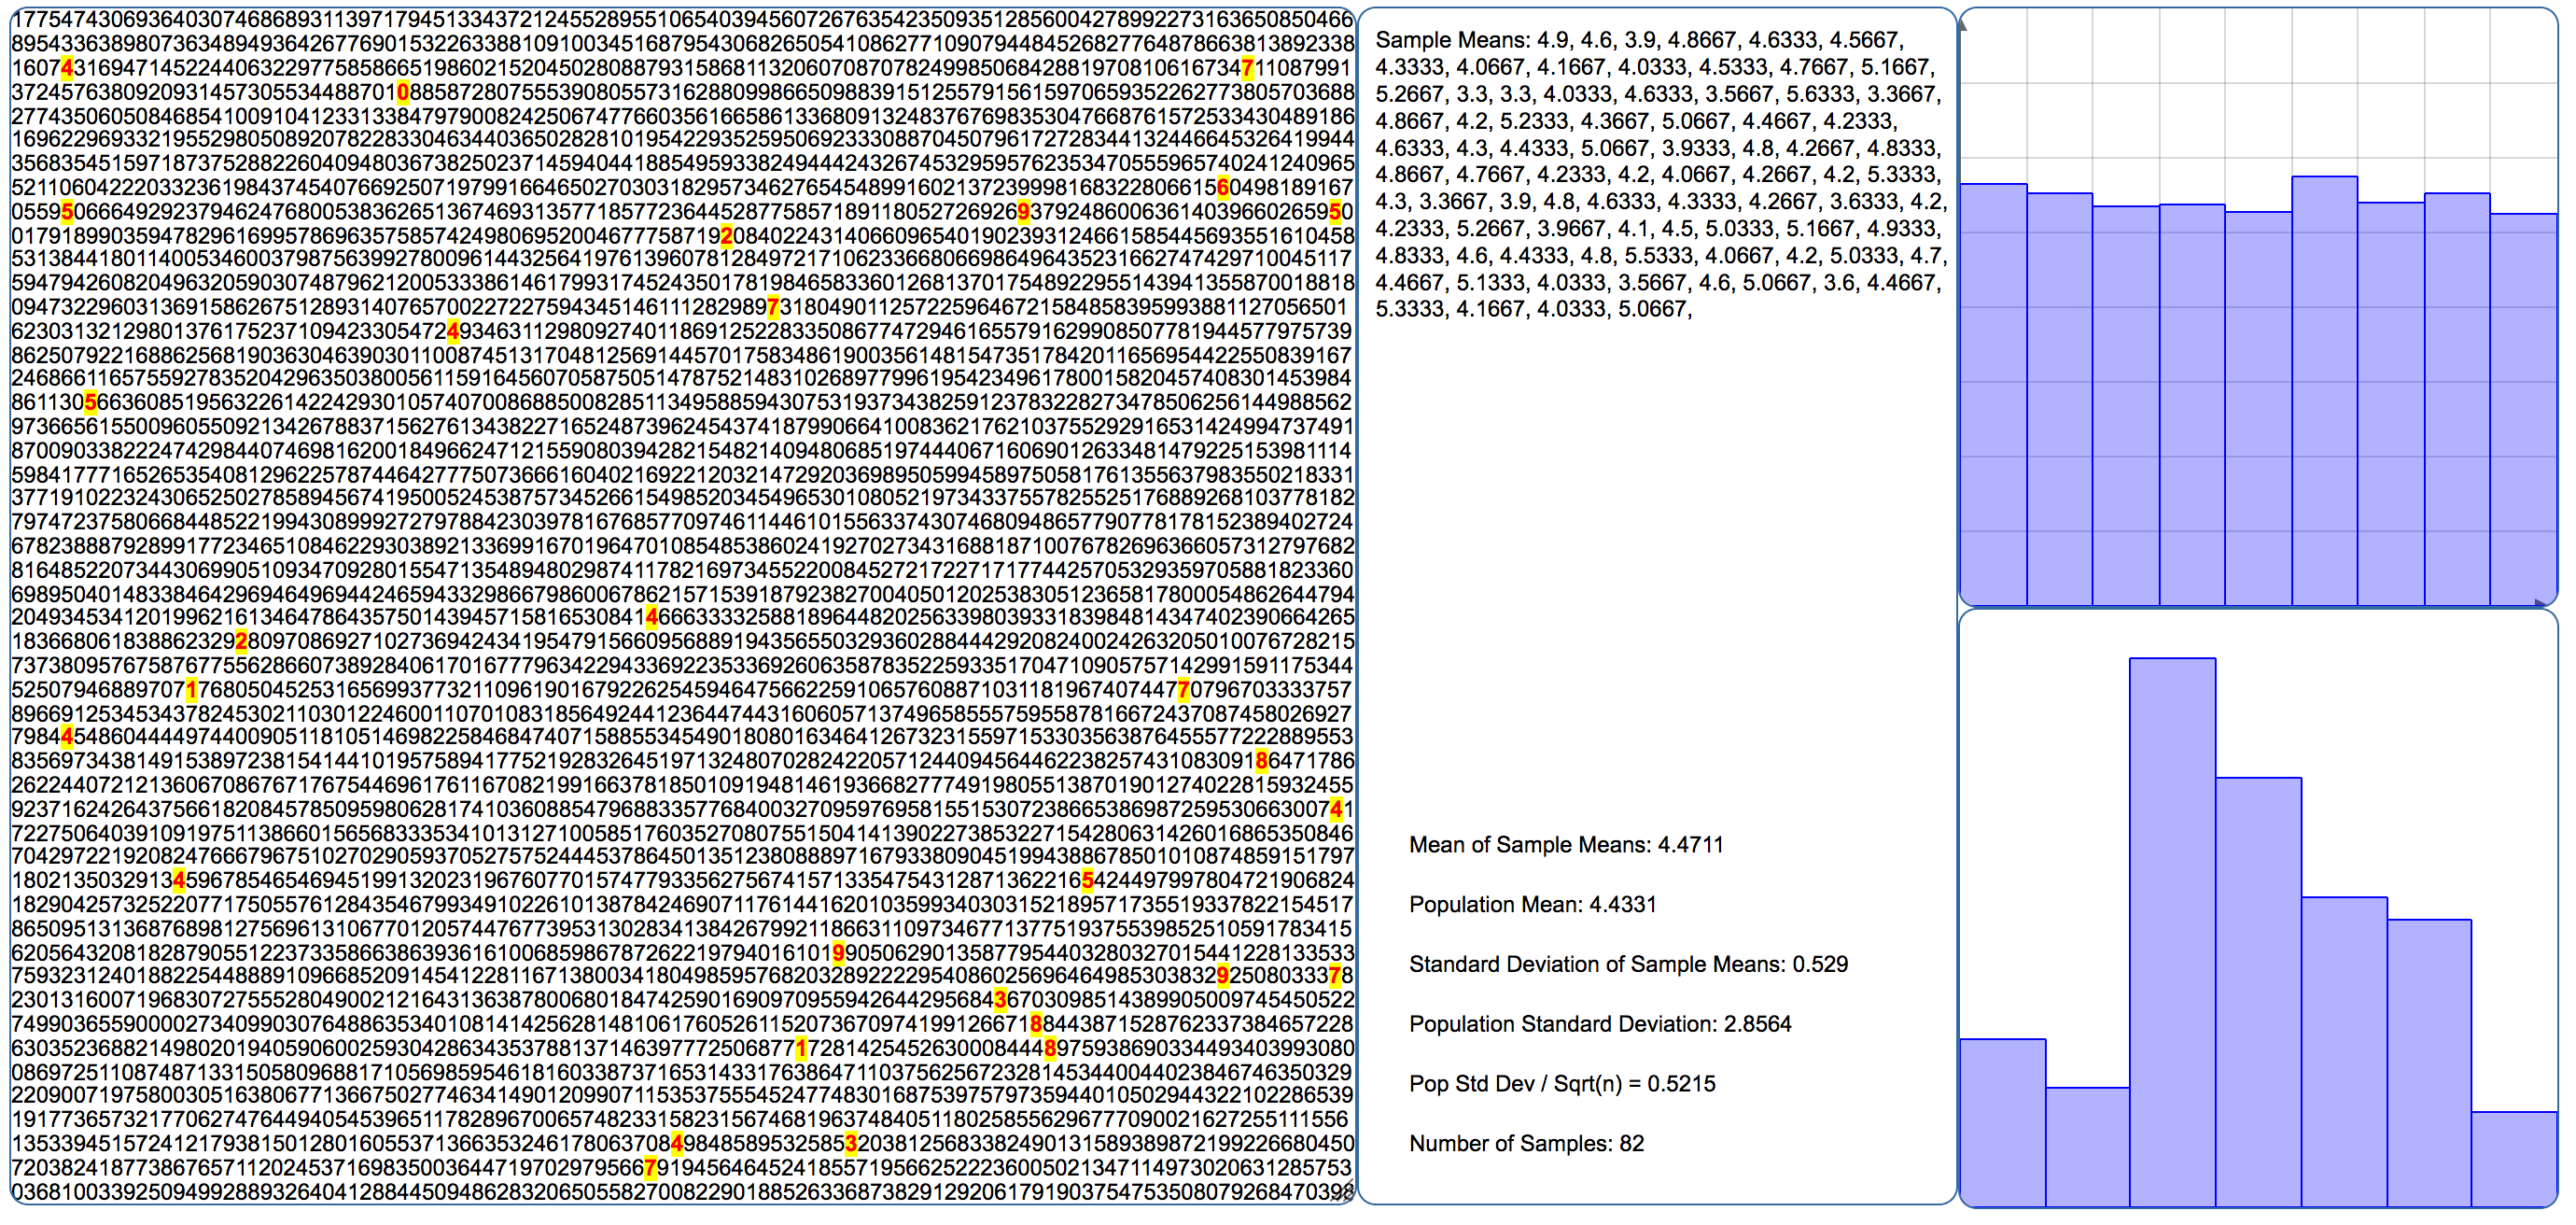
Central Limit Theorem
Allows user to create random samples and visually see how the central limit theorem works by creating the
sampling distribution for the mean of randomly selected samples out of a population. It will also allow you to choose the type of distribution that the
population derives from.